Flood-driven jet flow and sedimentary regime in a river-dominated estuary
 Jing Liu
 Yitong Lin1,2
  Feng Liu
 Wen Wei
- 1School of Ocean Engineering and Technology, Sun Yat-Sen University, Guangzhou, China
- 2Southern Marine Science and Engineering, Guangdong Laboratory(Zhuhai), Zhuhai, China
- 3Guangdong Province Engineering Research Center of Coasts, Islands and Reefs, Sun Yat-Sen University, Guangzhou, China
Sediment dynamics under floods are critical for estuarine morphological evolution. A two-dimensional coupled hydrodynamic/sediment transport numerical modeling was adapted to investigate the flood-driven jet structure and the resultant sedimentary regime in a river-dominated estuary, Modaomen Estuary, Pearl River Delta, China. The results show that the flow velocity of flood jet exhibits a Gaussian distribution in the transverse direction and shows a linear decreasing trend in the longitudinal direction. Moreover, a distinct zonation, including a zone of flow establishment (ZOFE) and a zone of established flow (ZOEF), was detected. The ZOFE was the core area of high turbidity and strong erosion and provided sufficient sediments to the ZOEF, where sediment diffused and settled. Due to the settling lag, the sediment diffusion and deposition areas were larger than those of the jet. Estuarine geomorphology regulates the shape of flood jet, which shows an asymmetry configuration with the main body located at the west side of the bifurcated estuary. Tidal dynamics play a crucial role in altering the range of jet diffusion, especially in the longitudinal direction. Increased flood intensity has little effect on the jet structure and erosion/deposition pattern, but significantly increases the magnitude of seaward current velocities and bed level changes, as well as the transverse diffusion range of jet and sedimentation.
1 Introduction
River-dominated estuaries, where river flow dominates sediment transport, are found in many of the world’s largest river deltas, such as the Yangtze, Yellow, and Pearl Rivers in China, Nile River in Africa, Danube River in Europe, and Mississippi River in North America (Nienhuis et al., 2020). The sediment dynamics of river-dominated estuaries are an important aspect of land-ocean interactions under global change (Unverricht et al., 2013; Garel et al., 2014), and for the socioeconomic development of delta cities (Brondizio et al., 2016; Edmonds et al., 2021).
As the interface between rivers and oceans, estuaries have complex dynamics that involve frequent sediment transport. Their geomorphological evolution is influenced by various factors, among which the impact of floods is particularly significant (Jiang et al., 2017; Ratliff et al., 2018; Yang et al., 2019). Previous studies have shown that flood events can increase river discharge and sediment load several-fold compared to usual conditions. In regions with seasonal climates, water and sediment input to estuaries is often concentrated within a few large flood events, resulting in significant changes in estuarine geomorphology within short periods of time (Guan et al., 2015; Rickenmann et al., 2016; Brocchini et al., 2017). Moreover, recovery of the morphology can take several years, or even decades. Therefore, it is crucial to investigate the sediment dynamics of estuaries under flood conditions.
The geomorphology of estuaries differs significantly between flood and usual conditions (Cooper, 1990; Cooper, 2002; Maillet et al., 2006; Chatanantavet et al., 2012; Lamb et al., 2012; Hoitink and Jay, 2016). The first reason is that the greater energy output of the jet during floods resulting in a wider and more far-reaching spreading area (Harris et al., 2005), which causes a substantial amount of sediment to be transported to the estuary. In turn, high flow velocity, strong bed shear, and high turbulent diffusion in that region lead to rapid and significant deposition (Wright and Coleman, 1974). For example, He et al. (2020) found that sedimentation caused by extreme floods in the Lingding Channel of the Pearl River can reach up to 2.75 times higher than usual conditions. Additionally, floods not only increase water levels, flow velocities, and shear stress in inner estuarine channels and mouth bars, but also intensify tidal asymmetry, Eulerian residual currents, and the transport of suspended sediment toward the ocean (Wang et al., 2022). The combined effects of increased onshore sediment transport rate and enhanced coastal dynamics during floods result in strong erosion and deposition in estuaries (Kitheka et al., 2005). Meanwhile, the influence of ocean dynamics on runoff, sediment transport, and morphological processes in estuaries during floods is highly spatiotemporally differentiated, with significant regional and local differences in erosion and deposition patterns (Wright and Coleman, 1974; Kasvi et al., 2017; Choi et al., 2020). Current research mainly focuses on sediment transport and estuarine geomorphological evolution under one flood condition. By contrast, the jet structures and sedimentary regime induced by floods of various intensities in river-dominated estuaries are rarely studied.
Therefore, the river-dominated Modaomen Estuary (ME) in the Pearl River Delta (PRD) is selected to investigate the jet structure and the resultant sedimentary regime under flood conditions, through simulations of multi-intensity flood scenarios. The aims of this study are to: 1) examine the flood-induced jet structure, sediment diffusion process, and sedimentary regime in estuaries; 2) clarify the alterations of estuarine sediment dynamics under different flood effects; and 3) identify the linkage between jet and sedimentary regime during floods. The findings could deepen our understanding of the estuarine sediment dynamics in response to floods and provide theoretical support for estuarine management under global change.
2 Study area
The Pearl River in southern China is the third largest river in China. It has an annual runoff of 3,260 × 108 m3 and annual sediment transport of 70.98 × 10⁶ tons (Wu et al., 2006). The PRD, located in the south-central part of the Guangdong Province, China, covers an area of 56,000 km2, It is a complex delta formed by the convergence of several rivers, including the Xijiang, Beijiang and Dongjiang Rivers, and has a complex river network. The Xijiang River branches into two distributaries at Baiqiantou; the Modaomen River, which is the main channel, enters the sea near Shilanzhou, forming a mouth bar and two channels to the west and east. The west channel is the main channel in terms of both river and tidal currents (Figure 1).
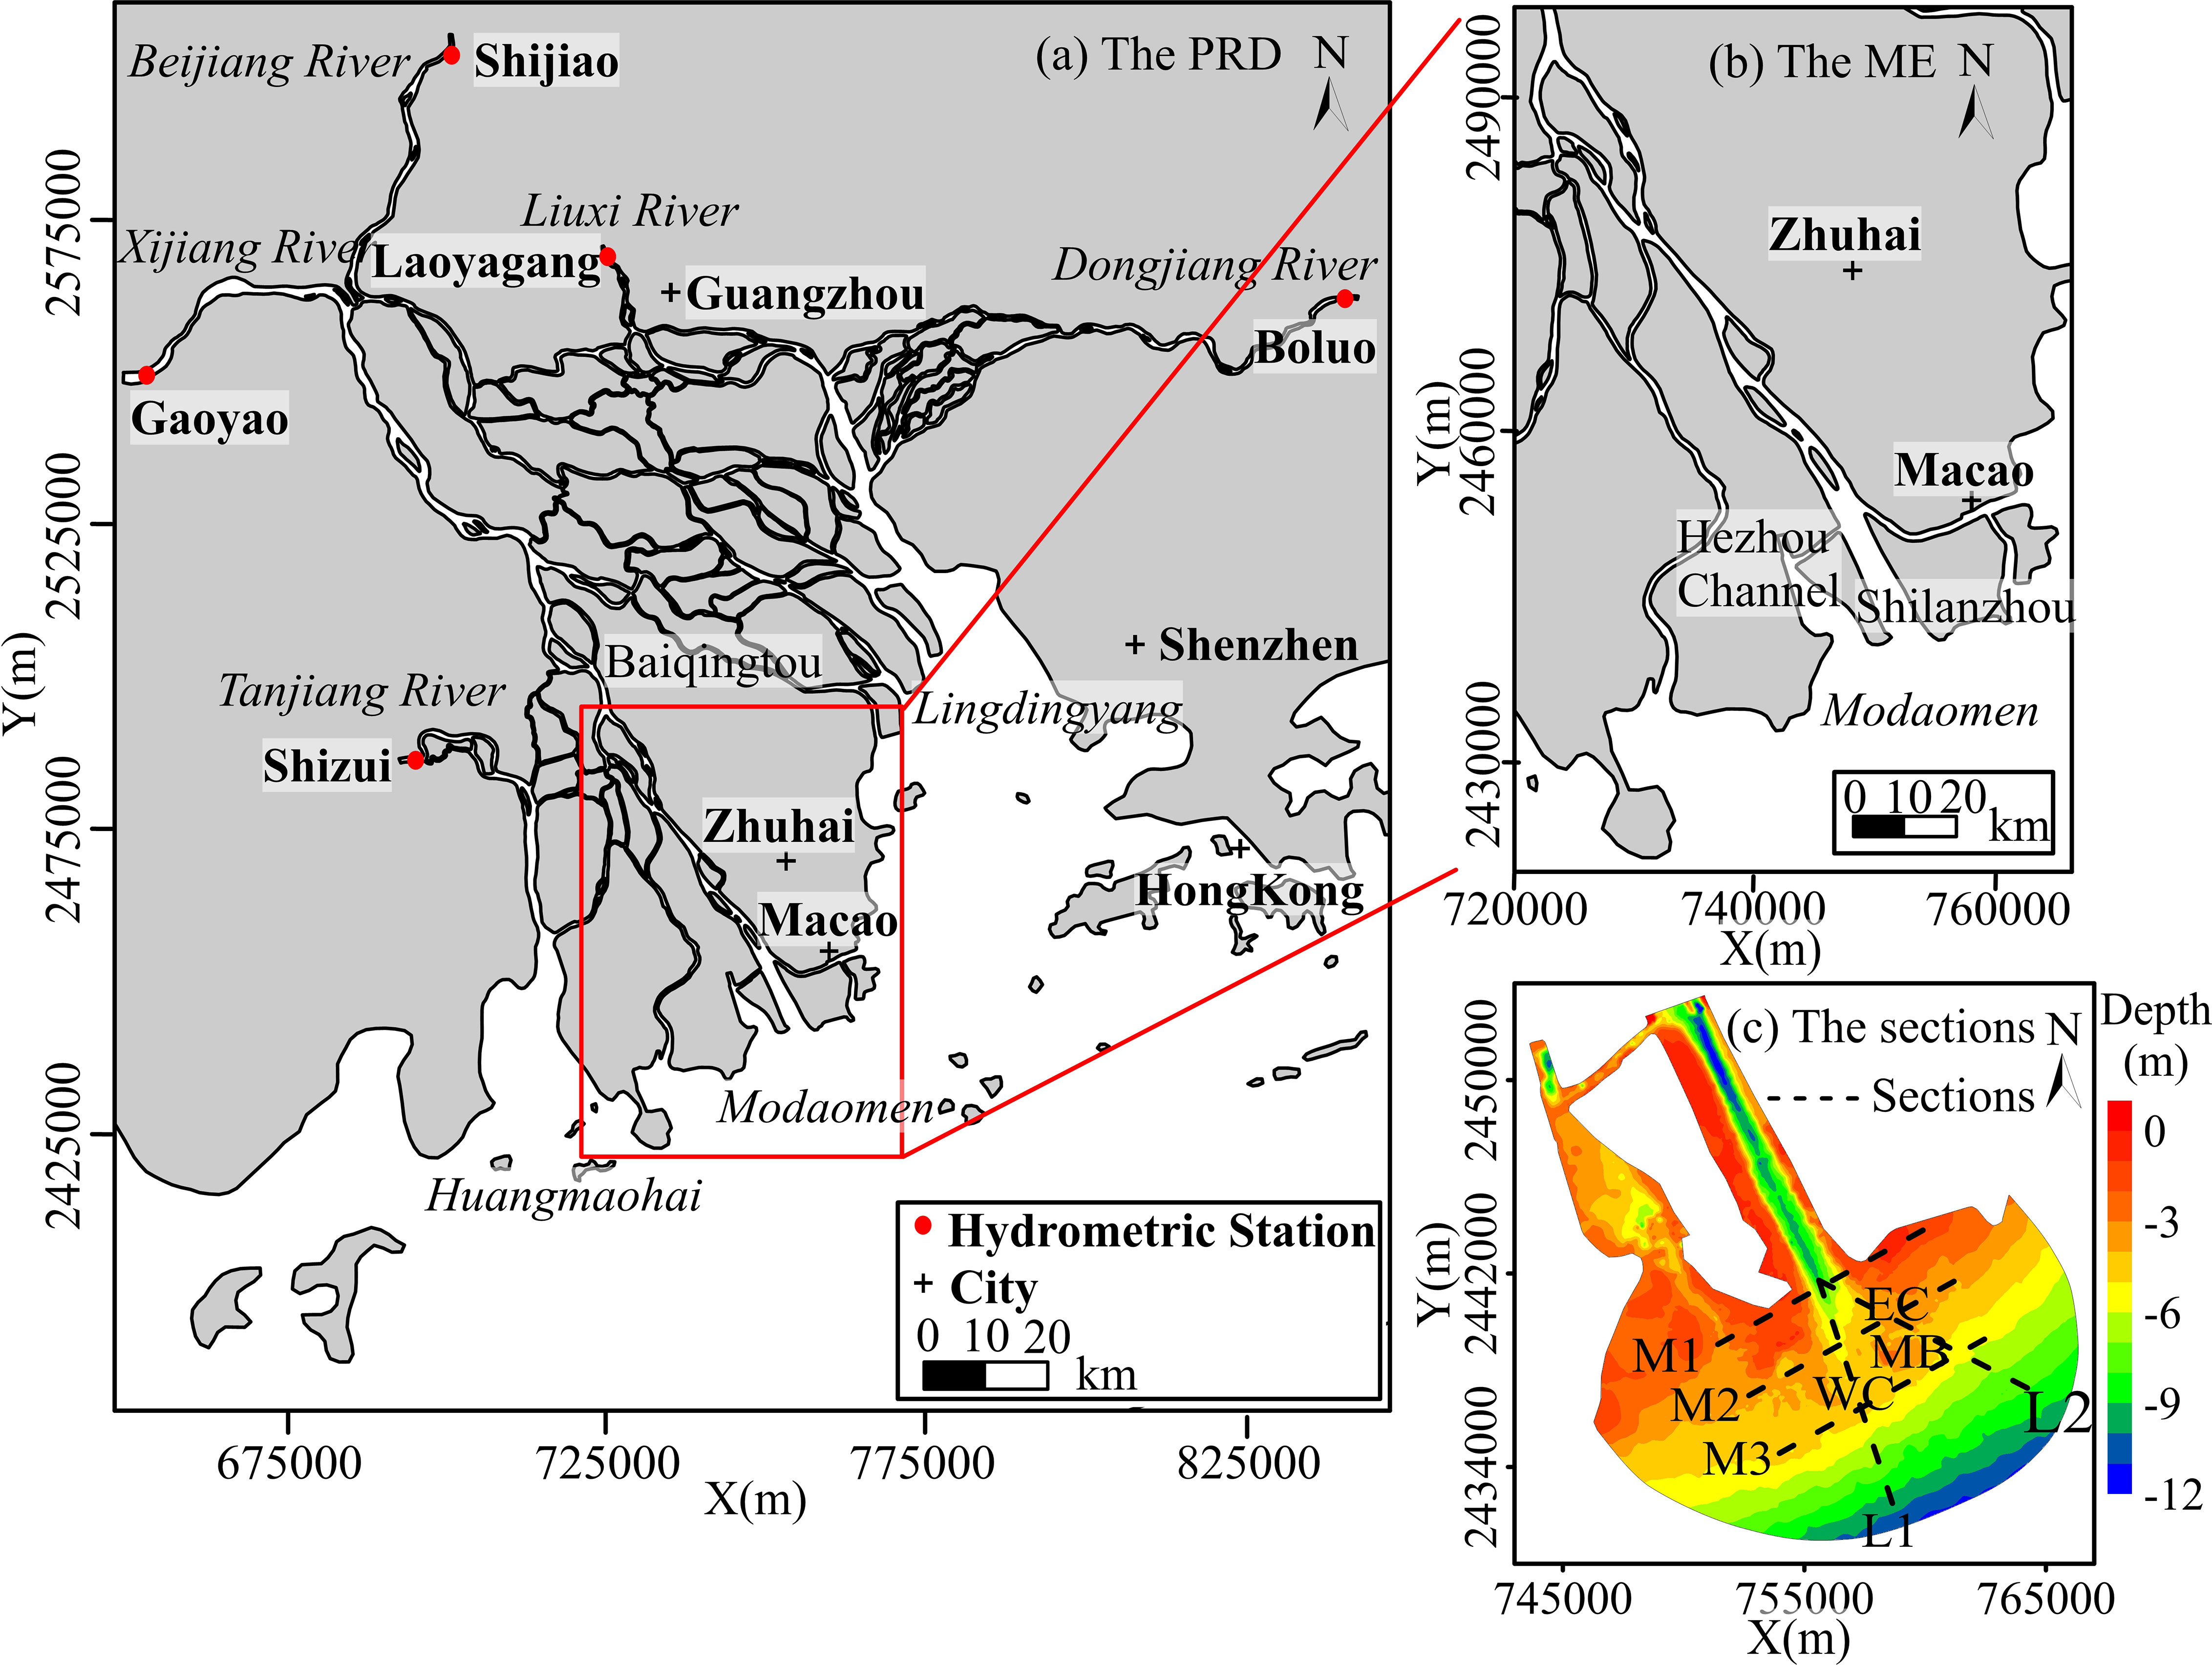
Figure 1 Pearl River Delta and the location of the modaomen estuary (A). Geographic setting of the Modaomen Estuary (B). Bathymetry of the estuary and locations of the sections (MB - the mouth bar, WC - the west channel, EC - the east channel) (C).
On an annual basis, the ME discharges 923 × 108 m3 of water, and 23.41 × 10⁶ tons of sediment as measured at the Denglongshan station. These amounts represent 28.3% and 33% of the total amount of water and sediment, respectively, flowing into the sea through the eight major estuary outlets, Thus, the ME is the principal discharge channel of the Xijiang River, and is significantly impacted by runoff. Water and sediment inflows from upstream sources show obvious seasonal fluctuations, with the flood season (April-September) accounting for 70.4% and 86.6-99.0% of the annual runoff and sediment discharge, respectively.
The tides at the ME are relatively weak and of irregular diurnal mixed type. The mean annual tidal ranges at the Sanzao and Denglongshan tidal gauge stations are 1.11 and 0.86 m, respectively. The river runoff is strong in comparison with tides with the ratio of the mean annual runoff discharge to the tidal discharge being 5.77. The impact of waves is highly significant, with monthly average wave heights and periods ranging from 1.01-1.32 m and 5.15-5.70 s, respectively. The dominant wave direction is southeastward (Gong and Shen, 2011; Jia et al., 2013). At the entrance of ME, suspended sediment has a median grain size of 0.017 mm, with clay and silt comprising 80-90% of the sediment composition (He et al., 2018).
There are three primary hydrological control stations in the upstream region of the PRD, namely Gaoyao (Xijiang River), Shijiao (Beijiang River), and Boluo (Dongjiang River). The annual mean discharge (1960-2014) of 6,838, 1,325, and 736 m3/s, respectively. The floods with the return periods of 10-, 50- and 100-year are 41,900, 49,900 and 52,900 m3/s, respectively at Gaoyao station, 13,900, 17,600 and 19,000 m3/s at Shijiao station, and 8,250, 10,910, and 11,970 m3/s at Boluo station (He et al., 2020). Makou station, which is located in the upstream region of the ME, is an important hydrological control station jointly regulated by the Xijiang and Beijiang Rivers, with an annual mean discharge of 7,034 m3/s. The ME is susceptible to catastrophic floods especially when the flood peaks of the Xijiang and Beijiang River coincide. The maximum annual peak flow at the Makou station is 27,400 m3/s, and the highest recorded peak flow was 53,200 m3/s (measured in June 2005) (Lu et al., 2008).
3 Methods
3.1 Model set-up
The TELEMAC-MASCARET numerical simulation system is based on unstructured grids in finite element or finite volume numerical format. It is widely used for numerical simulations of irregular and complex estuary geometries (Hervouet, 2007). In this study, TELEMAC-2D hydrodynamics module and the SISYPHE sediment transport and bed evolution module were coupled to simulate the behavior of flow and sediment transport in estuaries, as well as their internal interactions.
Two models were established in this paper (Figure 2). Model I is a large-scale 2D hydrodynamic sediment-coupled model that includes the Pearl River network, estuary bays, and adjacent offshore area, with grid spacing ranging from 50 to 5,000 m. From east to west, the upstream boundaries are stations Boluo (Dongjiang River), Laoyagang (Liuxi River), Shijiao (Beijiang River), Gaoyao (Xijiang River), and Shiju (Tanjiang River). The maximum water depth at the offshore boundary is approximately 50 m. The upstream boundary conditions are driven by water level and discharge, and the data are obtained from daily discharge, water level, and suspended sediment concentration (SSC) data obtained at hydrological stations monitored by the Guangdong Province Hydrological Bureau during the study period. At the open ocean boundary, the model was forced by the hourly tidal level and velocity calculated by TPXO tidal prediction model. Model II is a small-scale ME 2D hydrodynamic sediment-coupled model with grid spacing ranging from 50 to 1,000 m. From east to west, the upstream boundaries are Baihantou, Hutiaomen and Niwanmen. The upstream boundary conditions are forced by hourly discharge, water level, and SSC data calculated by Model I. The offshore boundary conditions include hourly tidal level, velocity, and salinity data, where the tidal level and velocity is calculated by TPXO tidal prediction model, and salinity is a fixed value 35. The time steps were 10 s in the TELEMAC-2D and SISPHE modules.
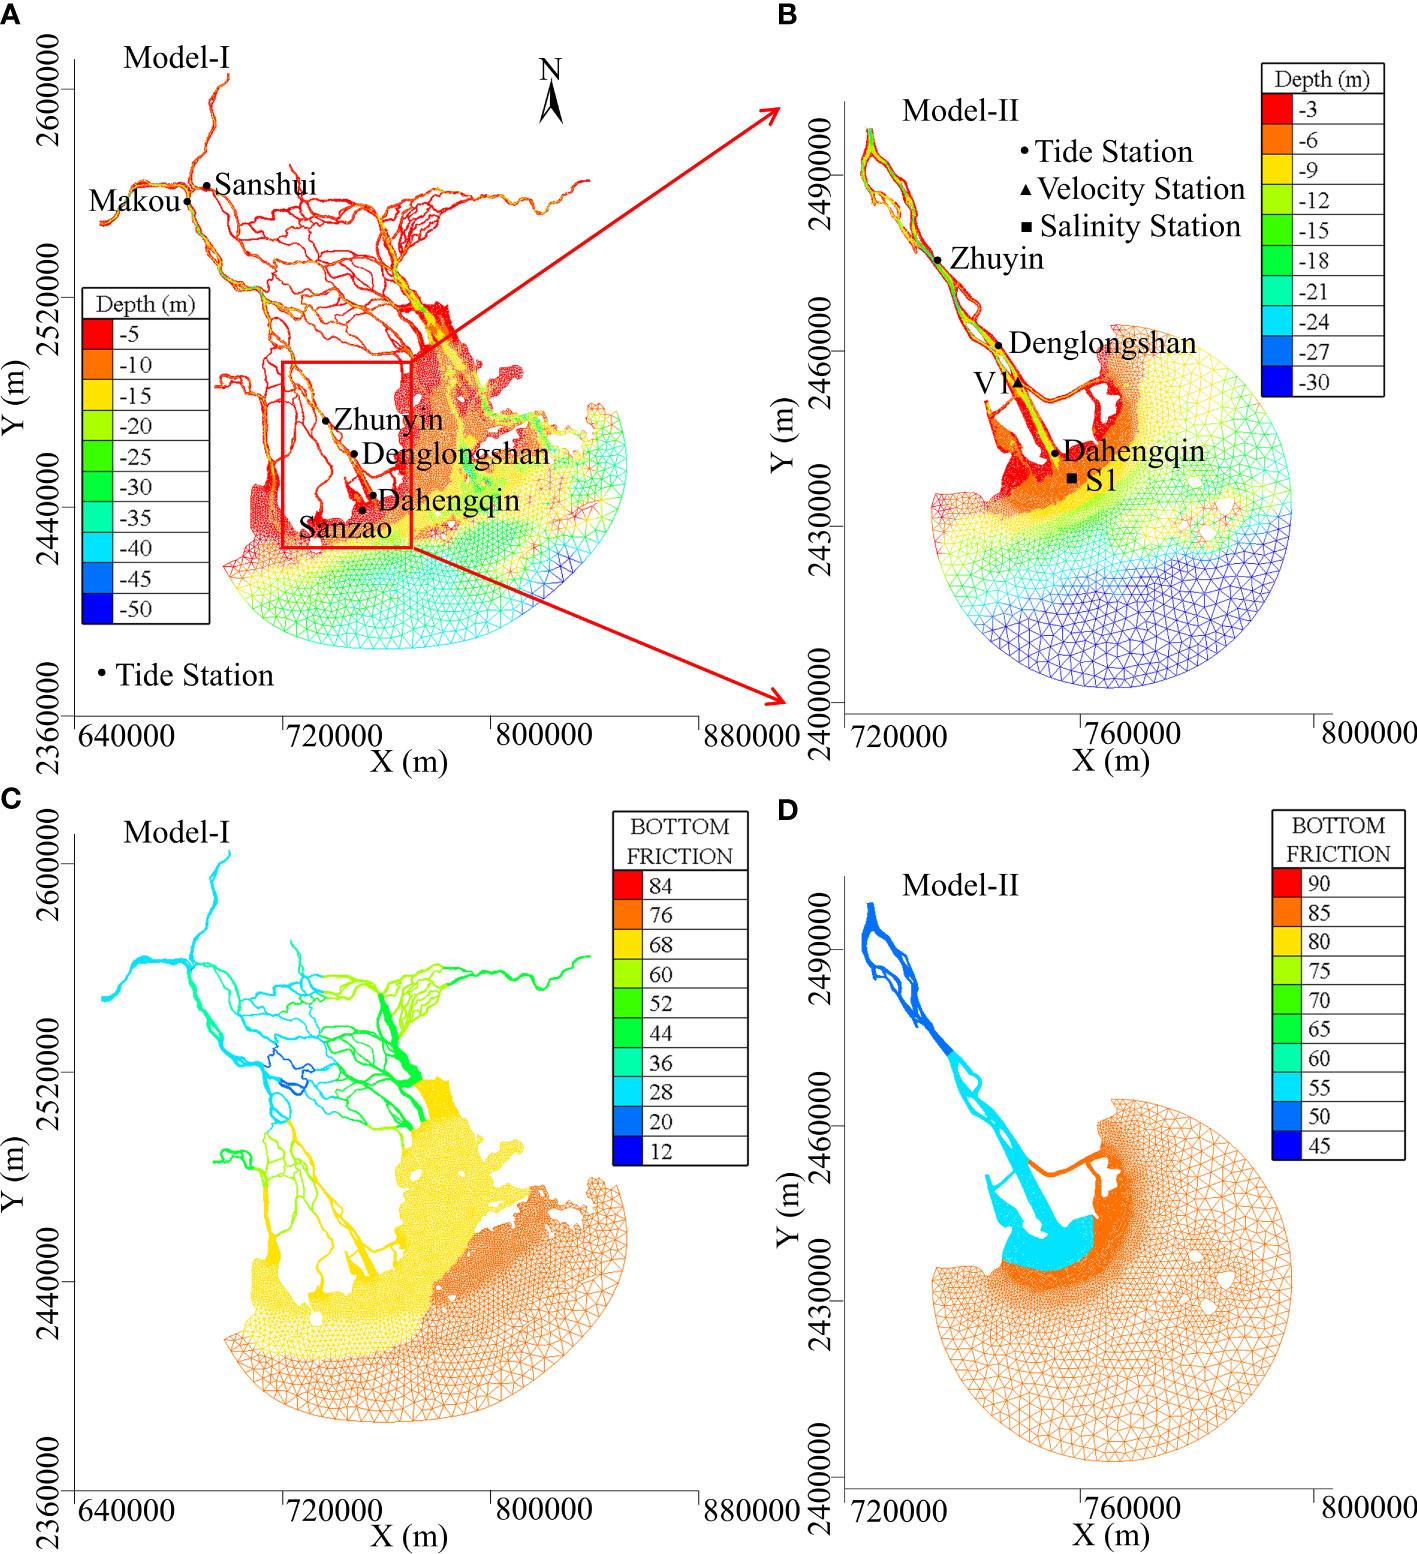
Figure 2 Computational grid of model I and locations of the tide stations (A). Computational grid of model II and locations of the tide/velocity/salinity stations (B). Friction coefficient setting of model I (C) and model II (D).
Models I and II use the Strickler coefficient as the friction coefficient; the settings are provided in Figures 2C, D, respectively. Both models use mixed sediment for calculation, with mean grain diameter of 0.1 mm (sand) and 0.05 mm (mud), and settling velocities of 0.001 and 0.0001 m/s, respectively. The bottom sediment in the model is divided into four layers with a thickness of 0.10, 0.15, 0.25 and 0.30 m for each layer. The Partheniades coefficient is set uniformly to 1.0 × 10⁻⁴. The critical shear stress for erosion is set to 0.15, 0.25, 0.50, and 10.00 N/m2 for each layer, respectively. Parameters in this study are based on He et al. (2020; 2022), which have been validated by comparing the simulated and observed water levels, velocities, and SSCs.
3.2 Model simulation and validation
Models I and II were applied to simulate three flood scenarios based on actual flood events (Figure 3): a 100-year return period flood that occurred from 2:00 on 19 June to 19:00 on 26 June 2005, with a peak flow of 54,500 m3/s at Gaoyao station (Xijiang River); a 50-year return period flood that occurred from 0:00 on 14 June to 17:00 on 23 June 2008, with a peak flow of 47,100 m3/s at Gaoyao station; and an usual flood that occurred from 17:00 on 1 July to 10:00 on 11 July 2017; which approached the mean annual flood flow, with a peak flow of 42,400 m3/s at Gaoyao station.
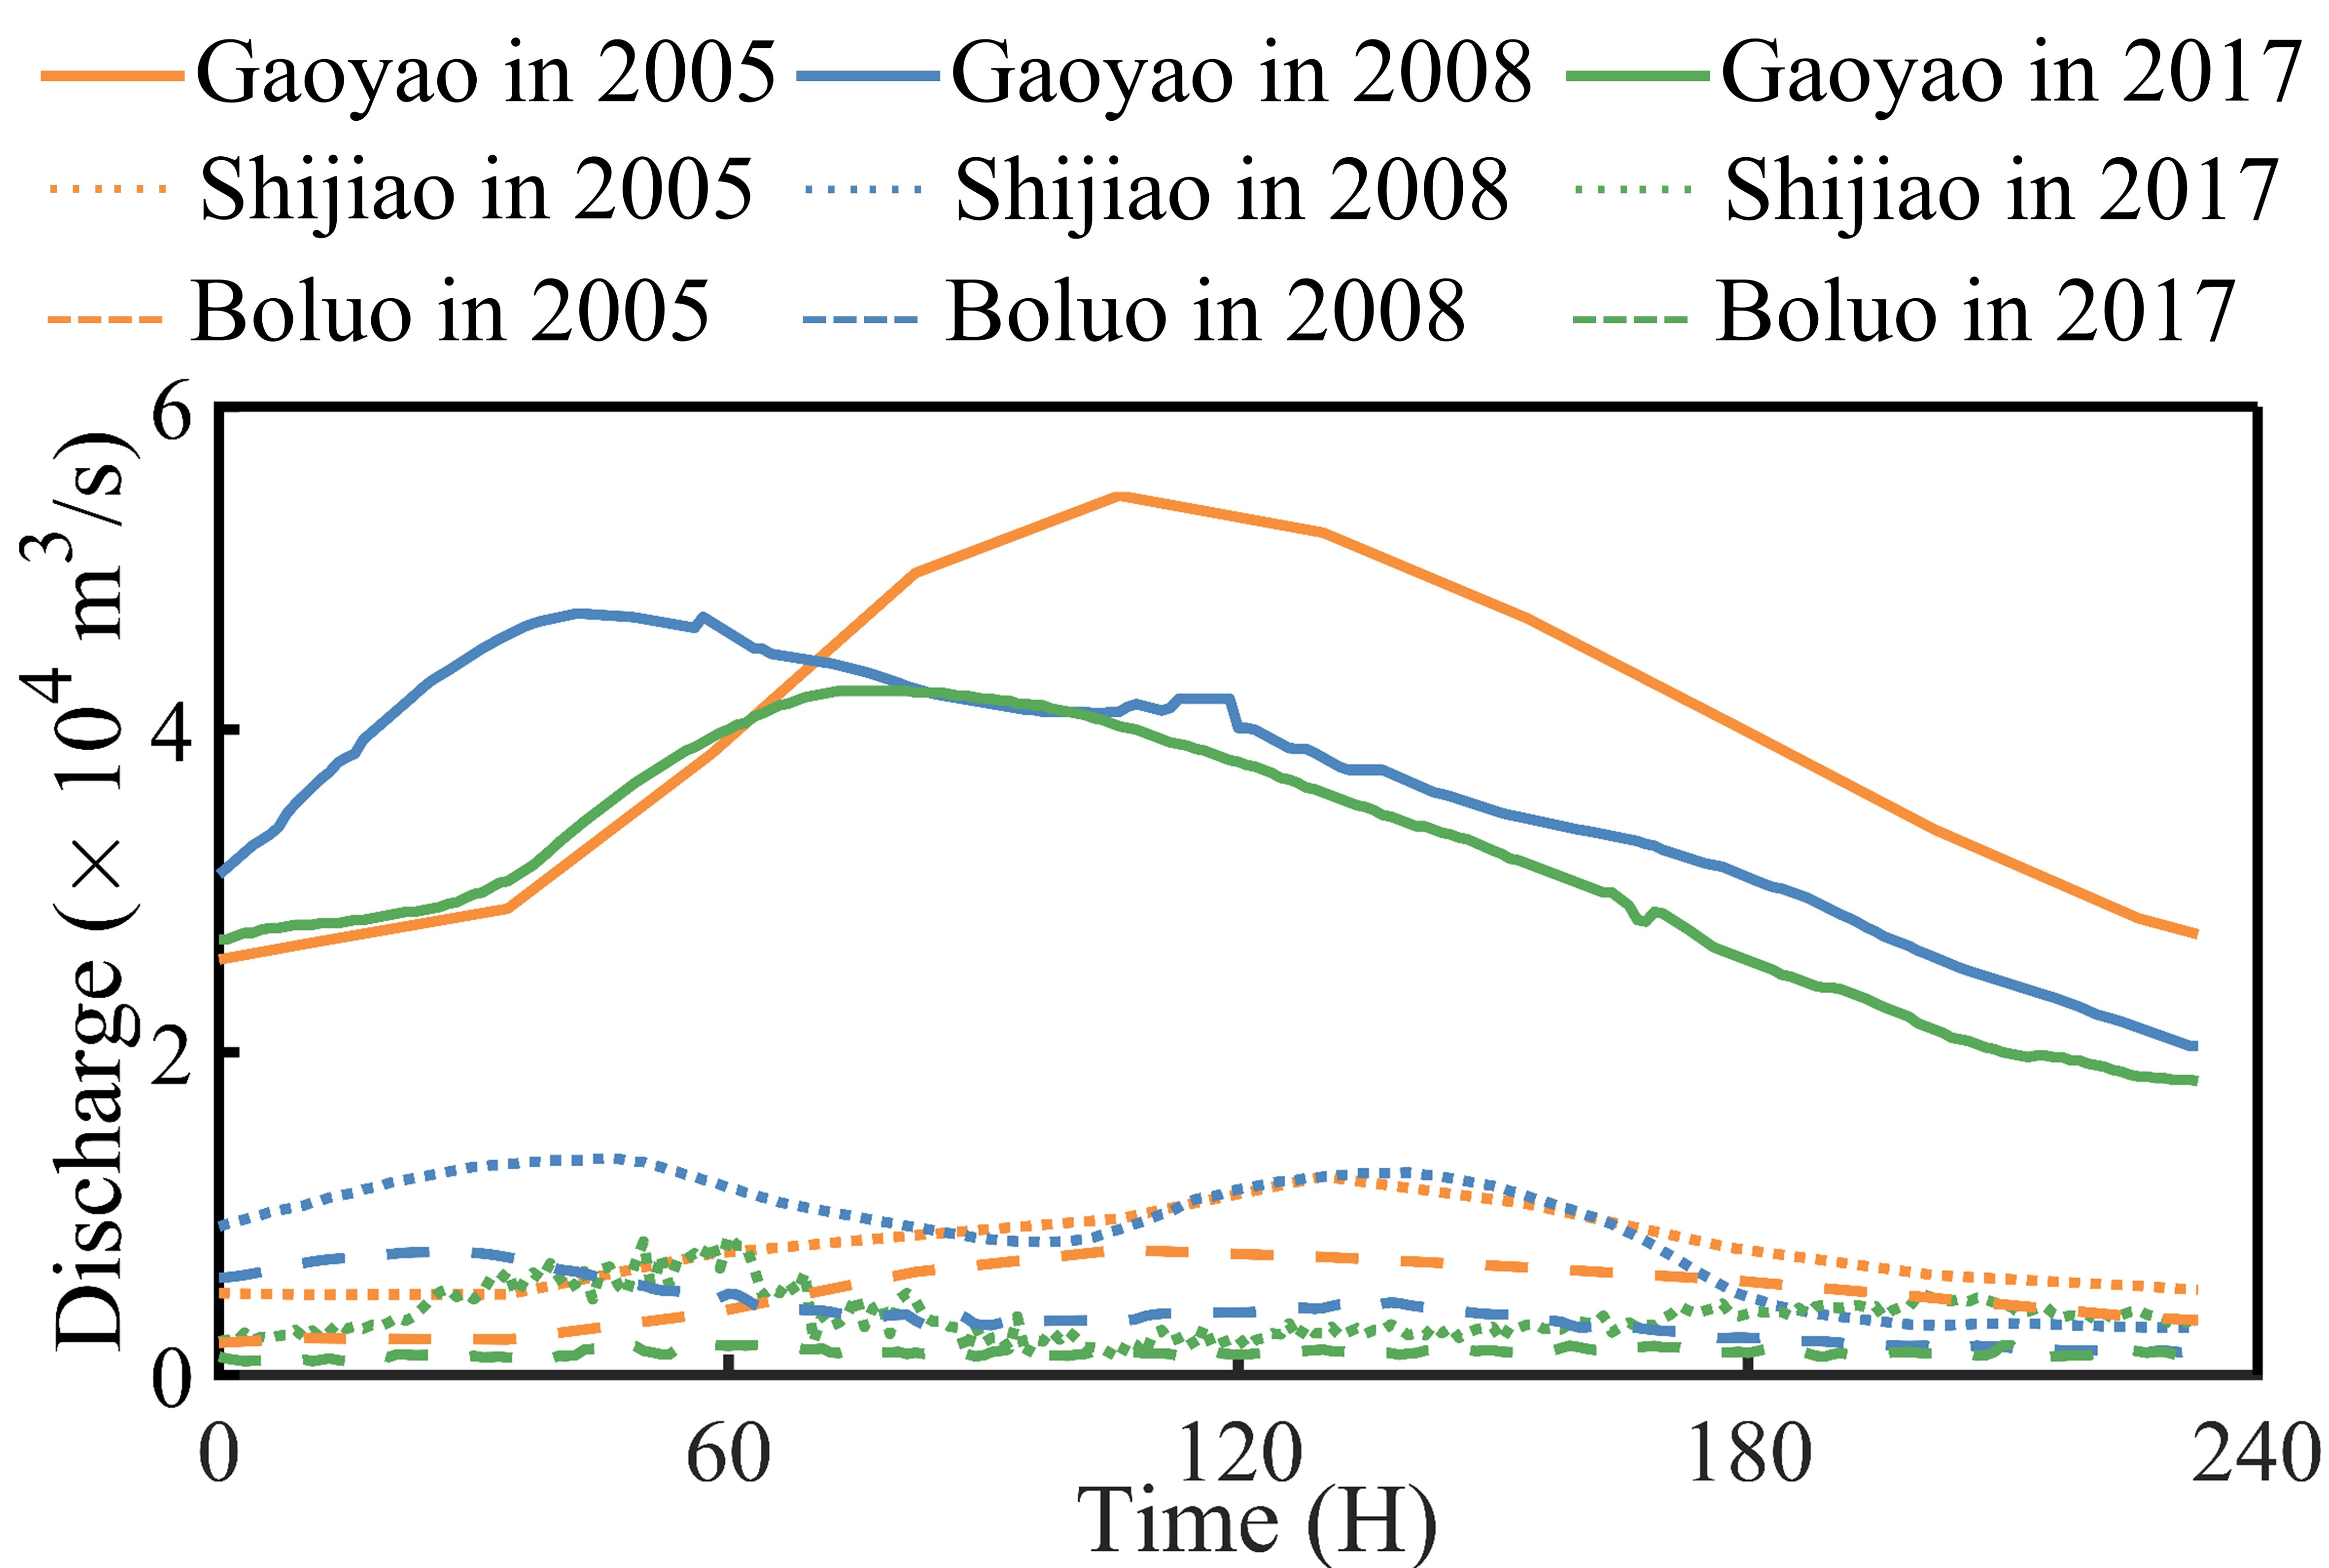
Figure 3 Measured discharge during floods of 2005 (06.19 2:00 - 06.26 19:00), 2008 (06.14 0:00 - 06.23 17:00) and 2017 (07.01 17:00 - 07.11 10:00).
Simulation results during usual flood scenario were used to calibrate the model based on observed hourly water level from six hydrological stations and observed hourly flow velocity, SSC, and salinity from two observation stations in the estuary. The model performance was evaluated using the root mean square error (RMSE), model skill score (SS), and correlation coefficient (r) for comparison of model and observation data (Tilmes et al., 2002). The water level verification period was from 0:00 on 8 July 2017 to 0:00 on 15 July 2017. The verification results showed excellent model performance. The salinity verification period was 0:00-8:00 on 1 August 2017 (neap tide). The simulated values exhibited a variation trend and magnitude similar to the observed data. The flow velocity and SSC verification periods were from 9:00 on 8 July to 9:00 on 9 July (spring tide) and 10:00 on 17 July to 10:00 on 18 July 2017 (neap tide). The simulated and measured values showed a relatively similar trend, and the results indicated acceptable model performance (Figure 4).
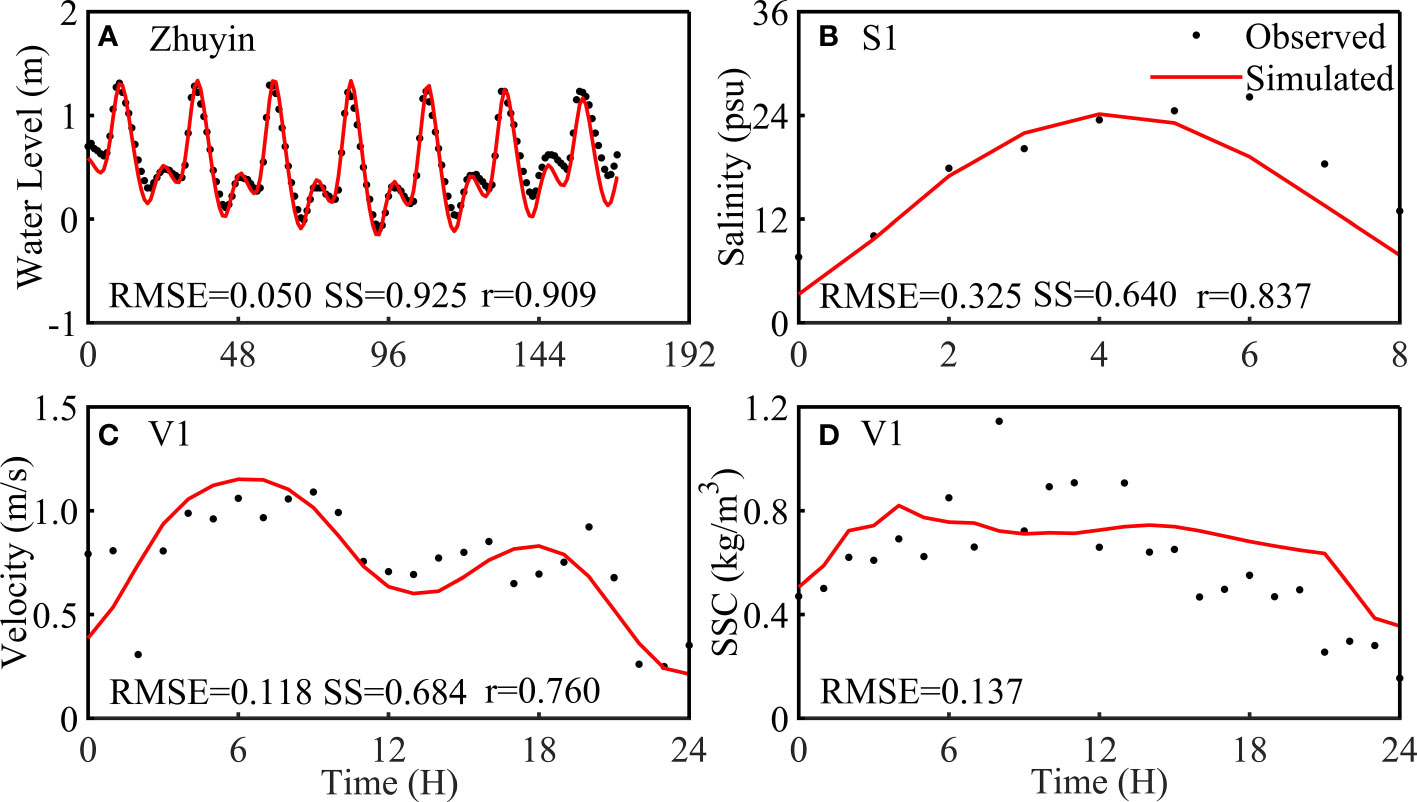
Figure 4 Comparison of simulated and observed water levels in Zhuyin station (2017.07.08 0:00 - 07.15 0:00) (A), salinity in S1 during neap tide (2017.08.01 0:00 - 8:00) (B), velocity (C) and SSC (D) in S1 during spring tide (2017.07.08 9:00 - 07.09 9:00). See Figure 2 for location of Zhuyin station, V1 and S1.
3.3 Jet structure analysis
A stream discharging into a large basin through a well-defined and stable orifice may be considered a free jet, so jet flow exists whenever a major river discharges directly into a lake, gulf, or ocean (Bates, 1953). During the flood period, river discharge and flow velocity significantly increase, resulting in a large momentum of outflow. And the Reynolds number of the cross-section at the outlet remains consistently above 108, indicating fully turbulent jet flow. The plume can be divided into three parts of dynamical regions: the near-field, the mid-field and the far-field plume (Garvine, 1984; Horner-Devine et al., 2015; Rijnsburger et al., 2021). According to van Reeuwijk (2016), the jet flow can be regarded as the near-field of the river plume. The three transverse sections and two longitudinal sections in the ME were selected to analyze the jet structure (Figure 1C). The transverse sections M1-M3 are on the south side of the outlet, on the north side of the mouth bar, and on the south side of the mouth bar, respectively. The longitudinal sections L1 and L2 are located in the west and east channels, respectively. Based on flow fields calculated by the model under different flood scenarios, the jet range was determined in the ME. The transverse and longitudinal diffusion ranges were established based on a flow velocity gradient approaching zero, and the jet was divided into two regions: the zone of flow establishment (ZOFE) and the zone of established flow (ZOEF). The former extends from the outlet seaward over a distance, xe, to the point at which the turbulent eddies generated at the jet boundaries penetrate to the centerline of the jet; it is characterized by a core of constant velocity. The longitudinal extent, xe, of ZOFE for any given outlet geometry is inversely proportional to the rate of jet expansion, ϵ, and to the integral, I, of the similarity function for transverse velocity distribution. Based on this theory and experiment, ‘the boundary between ZOFE and ZOEF generally occurs at a distance of 2-3 times the outlet jet width.’ (Albertson et al., 1950; Tennekes and Lumley, 1972; Ozsoy and Unluata, 1982; Fagherazzi et al., 2015). The length of the ZOFE was twice of the width of the outlet jet in this study due to the effect of bottom friction. The jet characteristics were analyzed under different flood intensity and calculated the rate of jet expansion (ε) as follows:
where D and D0 are respectively the width of the chosen and outlet sections, and L is the distance from the chosen section to the outlet section.
4 Results
4.1 Jet structure during flooding
The jet structure was analyzed under different flood scenarios (Figure 5, Table 1). The flow inside the outlet was consistently directed downstream and the velocity was significantly higher than that outside the outlet. After the runoff flowed out of the outlet, the transverse flow velocity showed a Gaussian distribution (Figure 6) and the longitudinal flow velocity exhibited an obvious decreasing linear trend (Figure 7); and this stabilized at 0.30 m/s at the end of the jet, indicating a distinct jet structure.
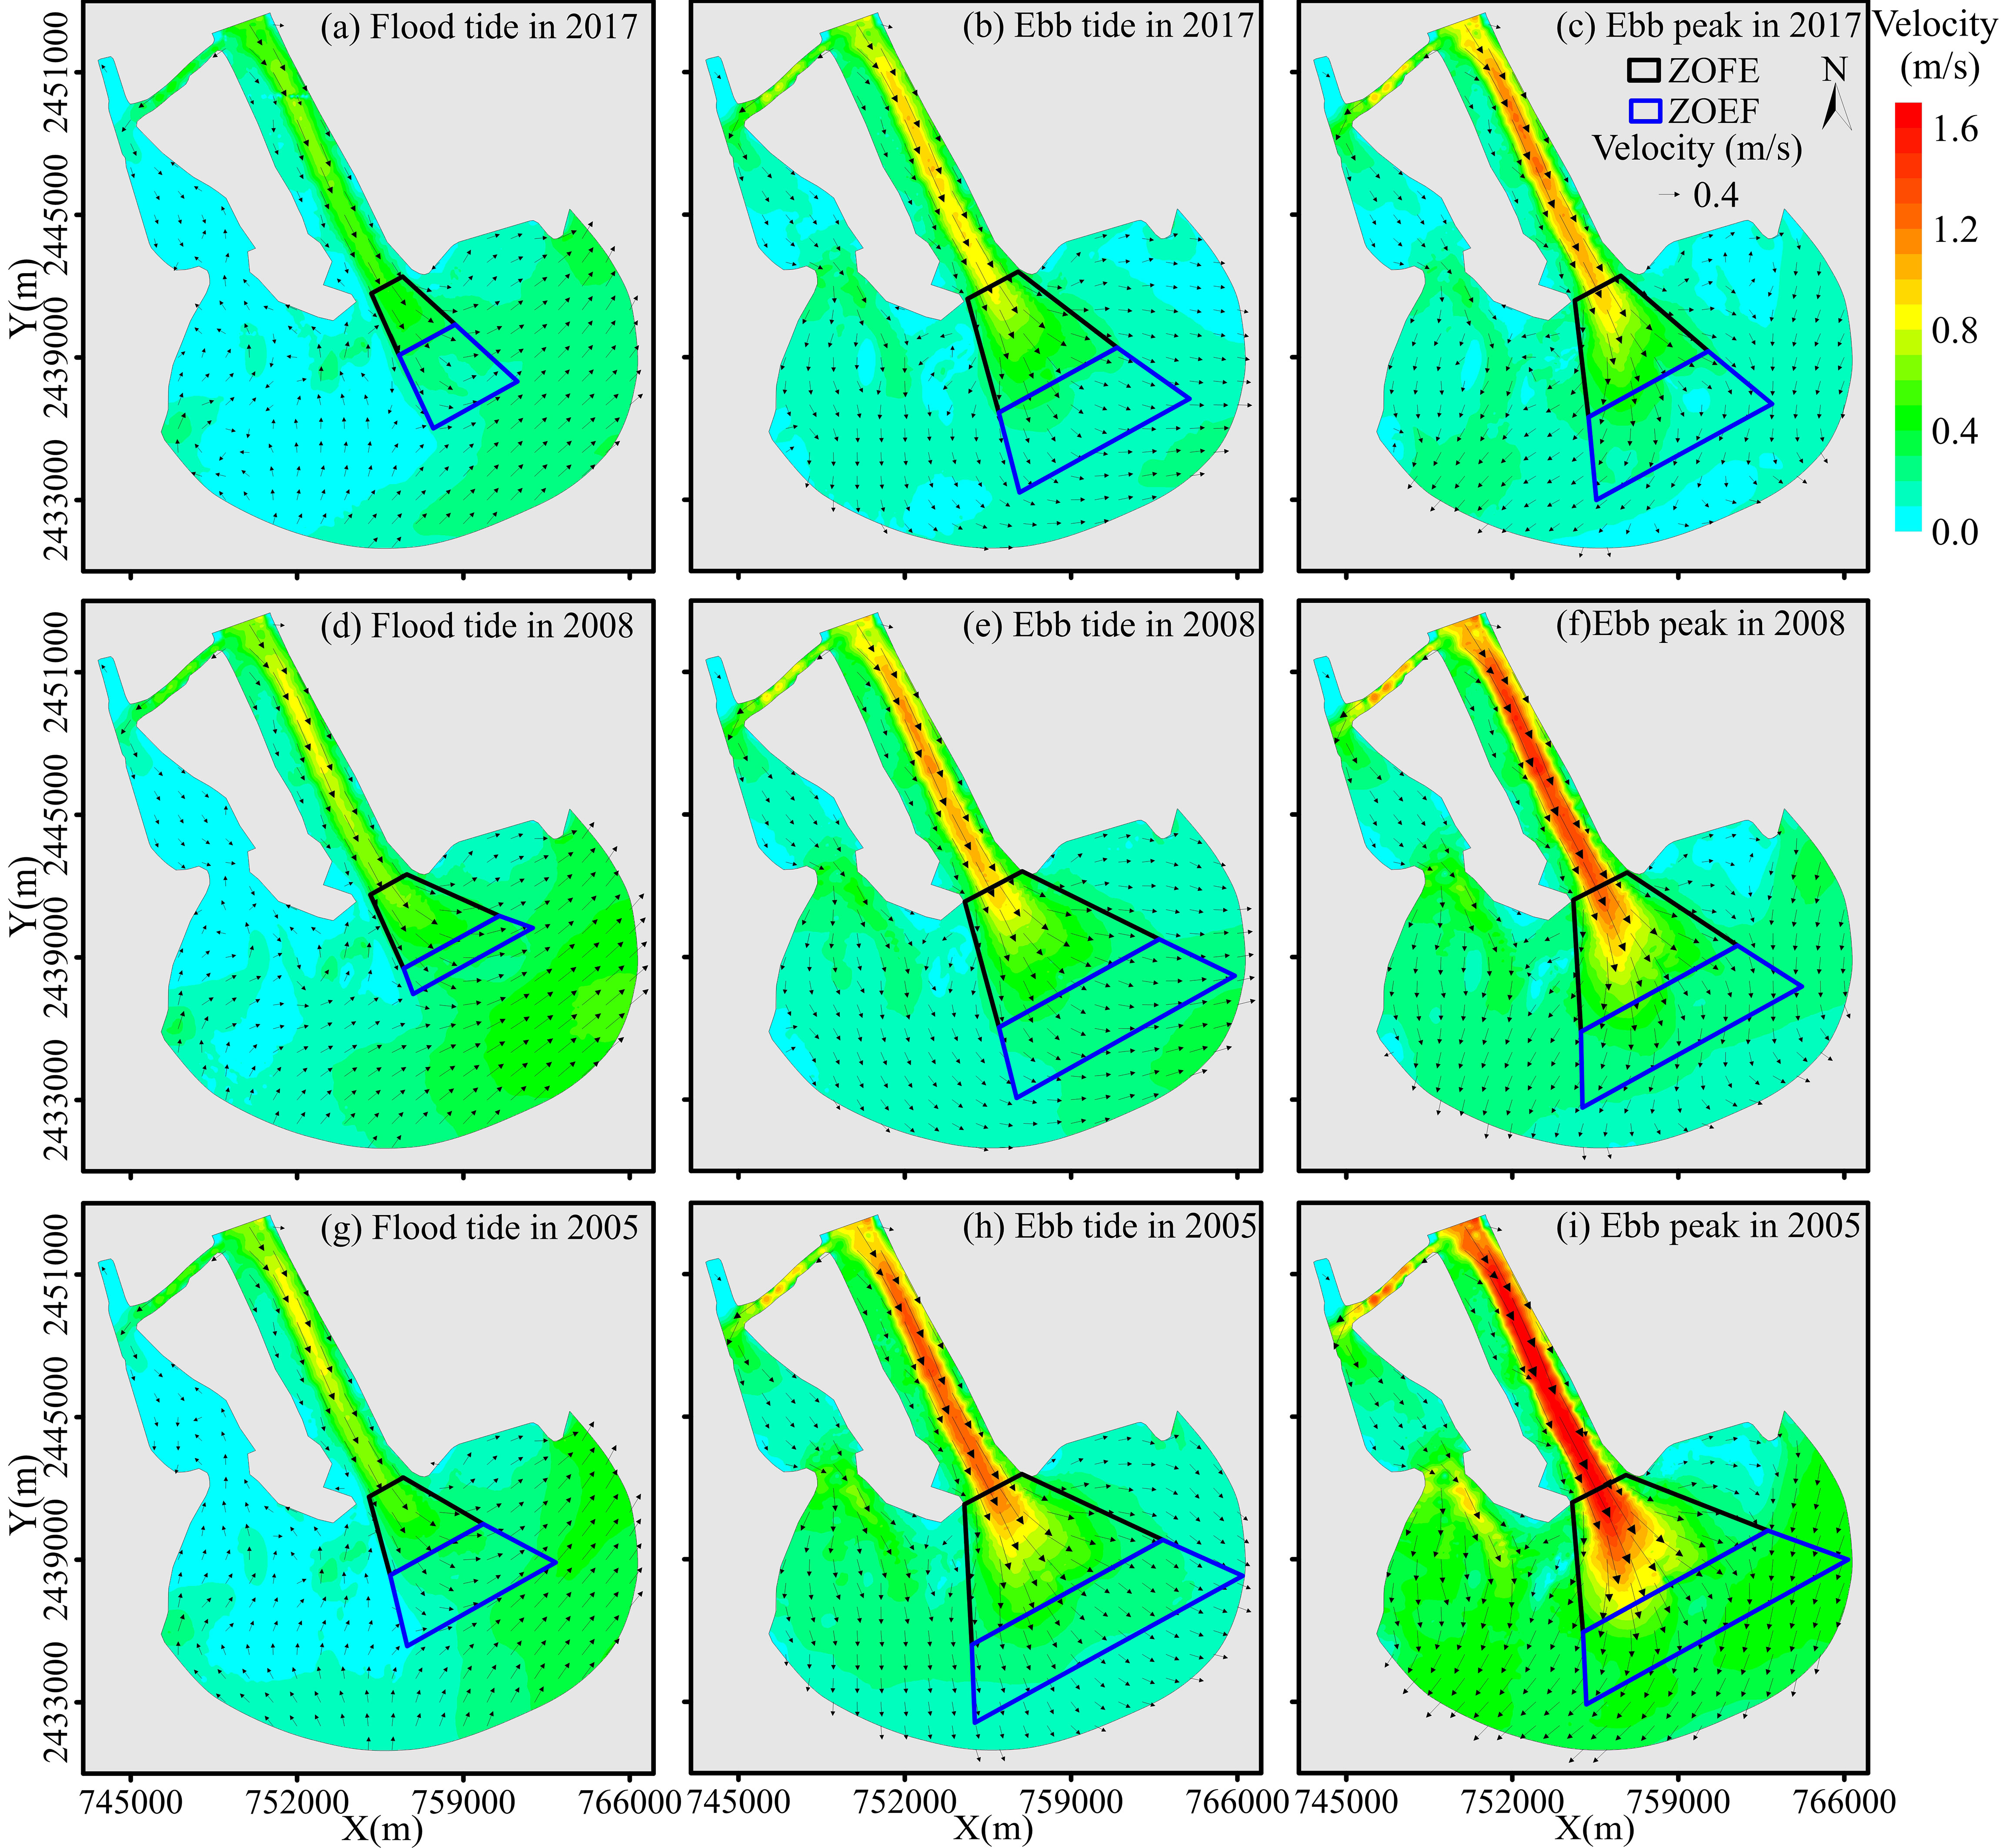
Figure 5 Vector of average flow during flood tide (A, D, G), average flow during ebb tide (B, E, H) and flow at peak ebb (C, F, I) during the 3 flood scenarios. The results during flood and ebb tides mean the average results during the entire flood tide and ebb tide durations.
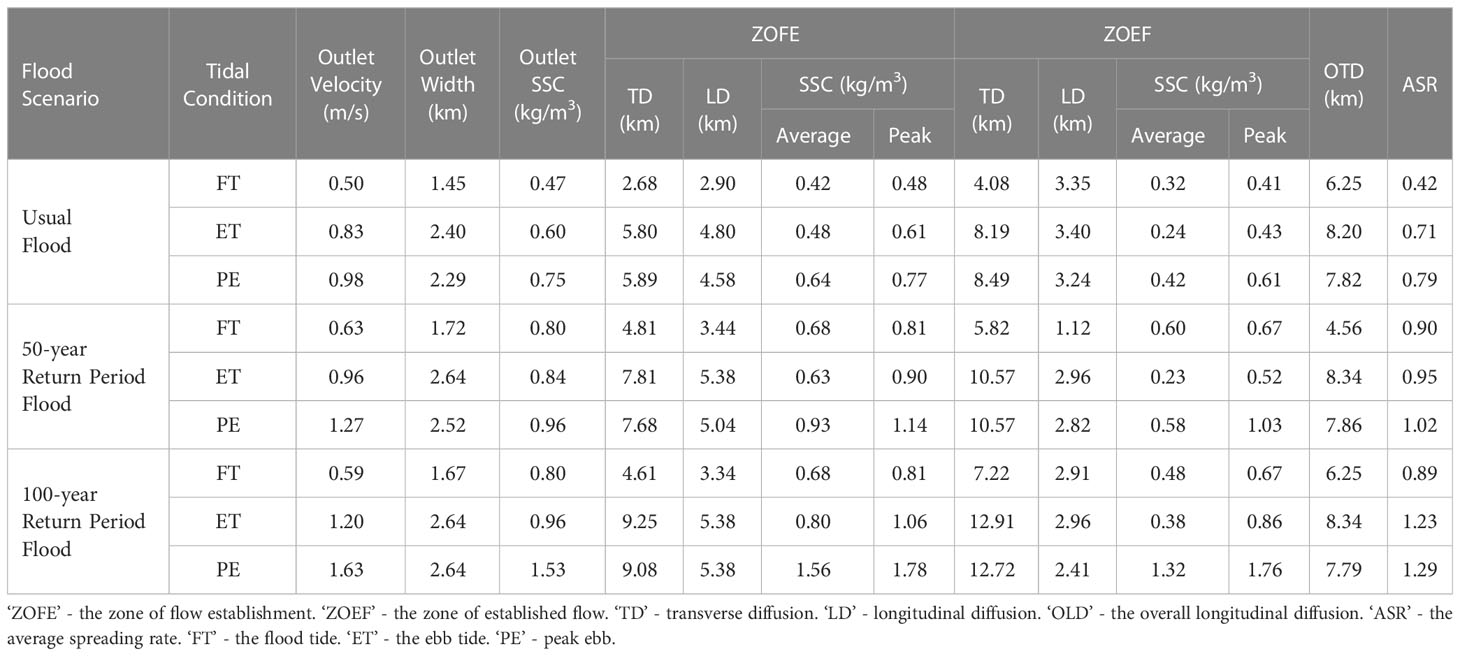
Table 1 Statistics of jet flow structures and suspended sediment distribution in the estuary during floods.
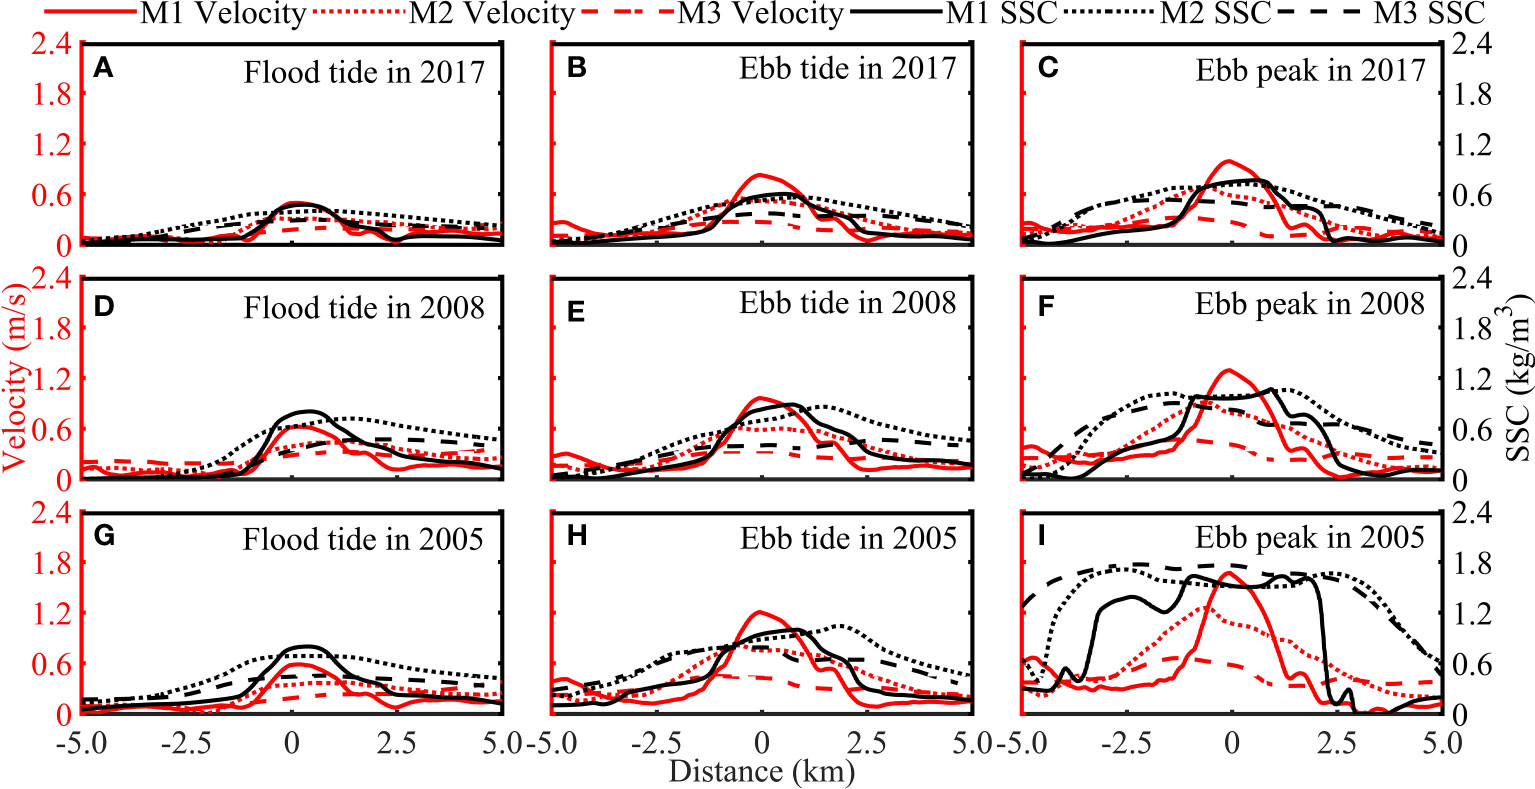
Figure 6 Variation of velocity and SSC in the transverse sections during flood tide (A, D, G), during ebb tide, (B, E, H) and at peak ebb (C, F, I) during the 3 flood scenarios.
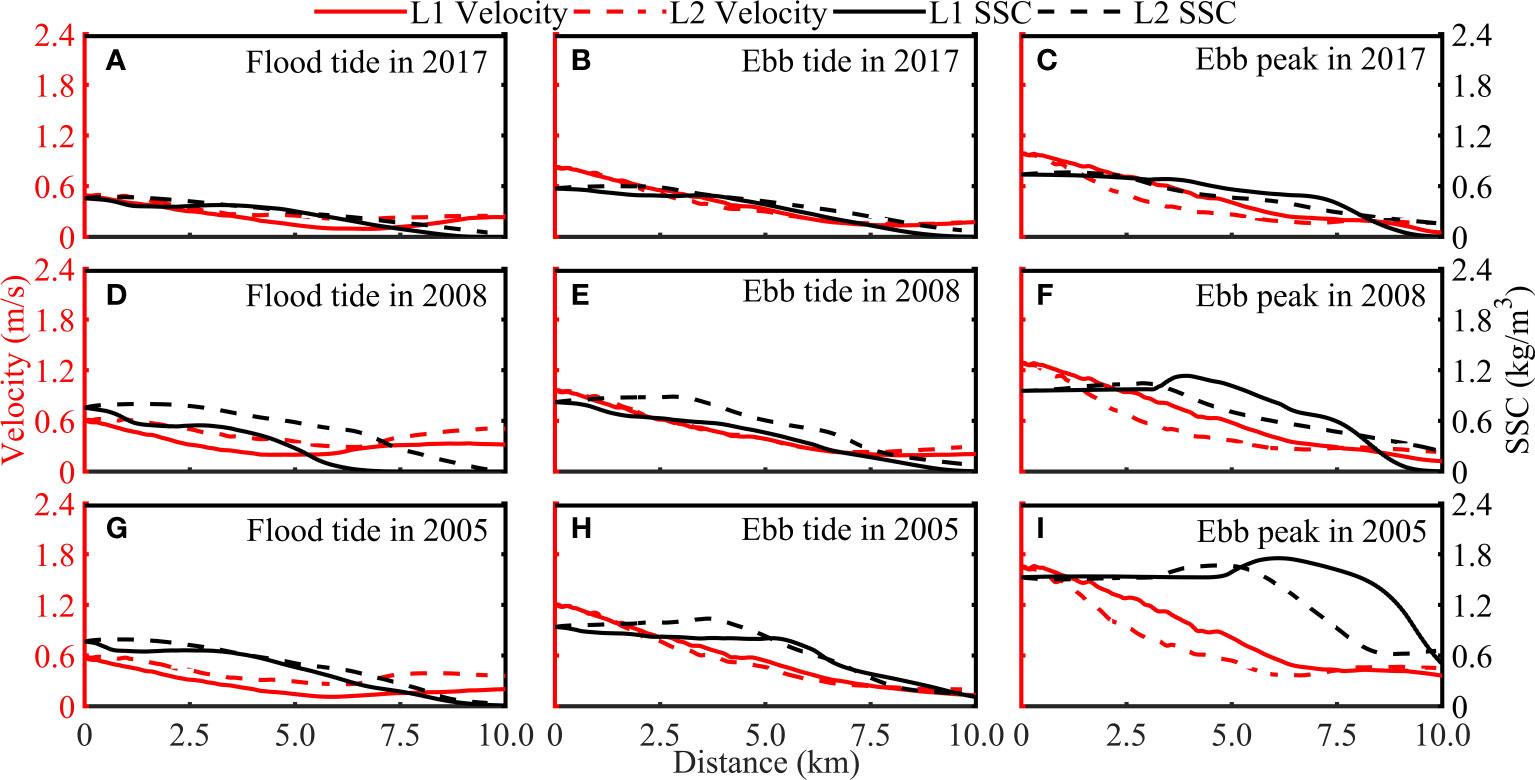
Figure 7 Variation of velocity and SSC in the longitudinal sections during flood tide (A, D, G), during ebb tide, (B, E, H) and at peak ebb (C, F, I) during the 3 flood scenarios.
The average range and flow velocity of the jet were lower during the flood tide than the ebb tide. For example, during the ebb tide, the transverse and longitudinal diffusion distance in the ZOFE were 2.16 and 1.66 times those during flood tide, respectively. By contrast, the transverse and longitudinal diffusion distance in the ZOEF were 2.00 and 1.01 times those during the flood tide, respectively. At the peak ebb, the transverse diffusion distance of the jet was slightly greater than that during the flood tide, whereas the longitudinal diffusion was slightly smaller. At M1, the peak flow velocities were 0.496, 0.828, and 0.990 m/s for the flood tide, ebb tide, and peak ebb, respectively. Additionally, there were differences in jet development between the east and west sides under different tidal conditions. During the flood tide, the flow velocity was higher in the east than the west channel, and the jet deviated to the east side. At this time, the longitudinal flow velocity decreased at the lowest rate, with flow velocity reduction rates of 0.058 and 0.077 m/s km−1 in the east and west channels, respectively. During the ebb tide, the jet diffused to the east and west sides simultaneously, with slightly higher flow velocity in the west channel than the east channel, and flow velocity attenuation rates of 0.130 and 0.127 m/s km−1 in the east and west channels, respectively. At the peak ebb, the flow velocity was higher in the west than the east channel, and the jet deviated to the west side. At this time, the longitudinal flow velocity decreased at the highest rate, with flow velocity reduction rates of 0.210 and 0.171 m/s km−1 in the east and west channels, respectively.
The jet size and internal characteristics varied in different flood scenarios. As the flood intensity increased, the flow velocity in the jet also increased and the longitudinal diffusion distance remained relatively constant, whereas the ZOFE increased slightly and the ZOEF decreased slightly. By contrast, both the ZOFE and ZOEF expanded significantly in the transverse direction. For example, at the peak ebb, the longitudinal diffusion distance of the jet remained constant at approximately 7.80 km for all three flood intensities. Compared to the usual flood, the ZOFE range increased by 0.46 and 0.80 km for the 50- and 100-year return period floods, respectively, and the ZOEF range decreased by 0.42 and 0.83 km, respectively. In the transverse direction, the ZOFE range increased by 1.79 and 3.19 km for the 50- and 100-year return period floods, respectively, and the ZOEF range increased by 2.08 and 4.23 km, respectively. The initial velocity of the jet and average flow velocity at M2 were 0.990 and 0.324 m/s, respectively, under the common flood scenario. As the flood intensity increased, the initial velocity of the jet increased by 0.302 and 0.681 m/s, respectively, and the average flow velocity at M2 increased by 0.114 and 0.300 m/s, respectively.
4.2 Suspended sediment distribution during flooding
The suspended sediment distribution in the estuary exhibited a similar structure to the jet during flood (Figure 8, Table 1). The average SSC at the outlet of the ME during flood season is approximately 0.1 kg/m3. Therefore, the sediment diffusion limit was set at the location where the SSC dropped to 0.1 kg/m3. The SSC inside the outlet remained relatively high, and SSC was higher inside the outlet than that outside the outlet during the flood tide and ebb tide. However, at the peak ebb, SSC was higher outside the outlet than that inside the outlet. The range of sediment diffusion was wider than that of the jets. The SSC had a Gaussian distribution in the transverse direction (Figure 6), and generally remained high before decreasing linearly in the longitudinal direction (Figure 7). The average and peak SSCs were higher in the ZOFE than ZOEF.
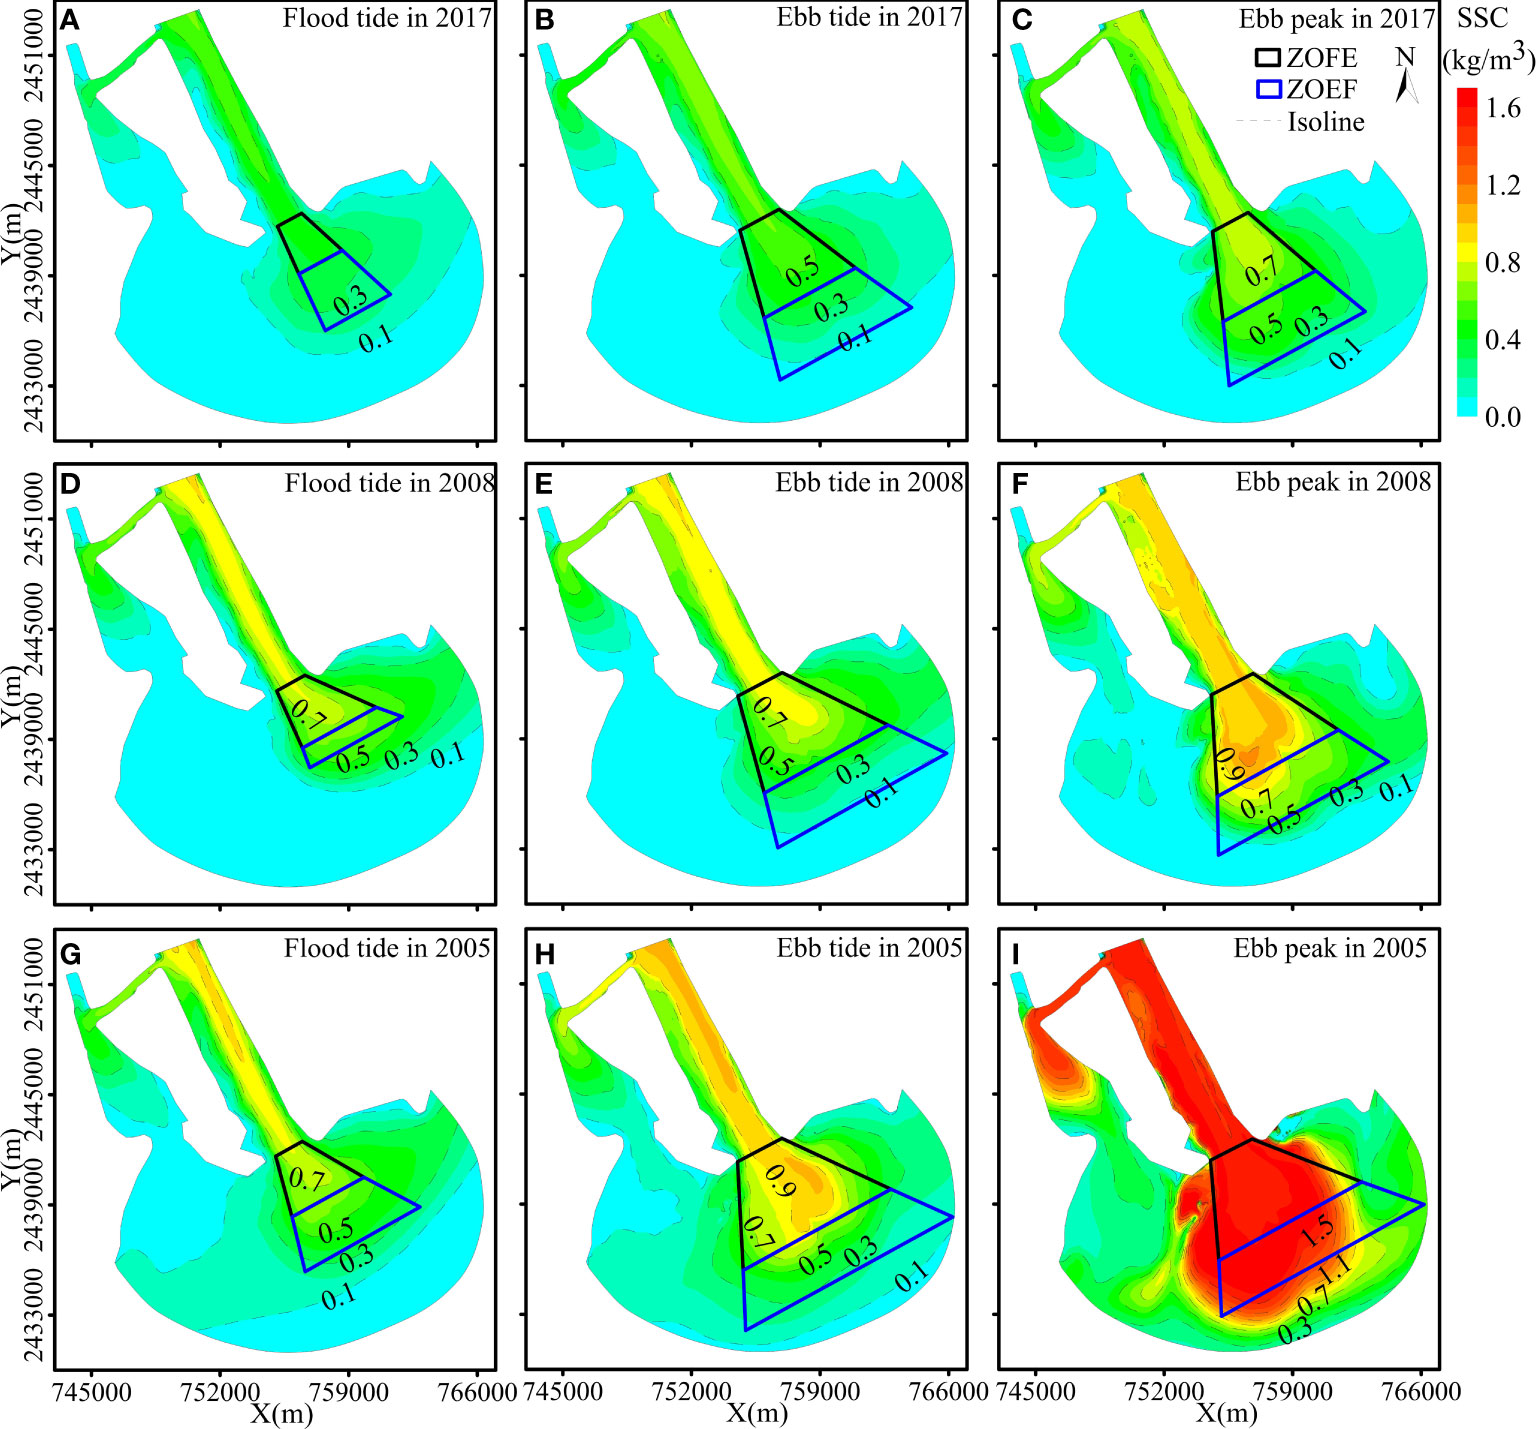
Figure 8 Distribution of average SSC during flood tide (A, D, G), average SSC during ebb tide (B, E, H) and SSC at peak ebb (C, F, I) during the 3 flood scenarios.
Under the same flood scenarios, the maximum and average SSCs at the outlet and ZOFE were lowest during the flood tide and highest at the peak ebb. By contrast, the maximum and average SSCs at the ZOEF were highest at the peak ebb, although the maximum value was lowest during the flood tide, and the average value was lowest during the ebb tide. For example, compared to the flood tide, the peak and average SSCs in the ZOFE increased by 0.13 and 0.06 kg/m3, respectively, during the ebb tide. In contrast, the peak and average SSCs in the ZOEF increased by 0.02 kg/m3 and decreased by 0.08 kg/m3, respectively. At the peak ebb, the peak and average SSCs in the ZOFE increased by 0.29 and 0.22 kg/m3, respectively, and the peak and average SSCs in the ZOEF increased by 0.20 and 0.10 kg/m3, respectively. Unlike the characteristics of the east and west sides of the jet, during the flood tide and ebb tide, SSCs were generally higher in the east than in the west channel, and the reverse pattern was observed at the peak ebb.
The distribution and scale of suspended sediment in estuaries varied under different flood scenarios. As flood intensity increased, SSC increased inside and outside the outlet, and the range of sediment diffusion expanded, with peak concentrations area moving further from the outlet. For example, at the peak ebb, compared to the usual flood, the peak and average SSCs in the ZOFE under a 50-year return period flood increased by 0.37 and 0.29 kg/m3, respectively, and the peak and average SSCs in the ZOEF increased by 0.42 and 0.16 kg/m3, respectively. Under the 100-year return period flood, the peak and average SSCs increased by 1.01 and 0.92 kg/m3, respectively, in the ZOFE, and by 1.15 and 0.90 kg/m3, respectively, in the ZOEF. In this flood scenario, the range of sediment diffusion in both the transverse and longitudinal directions, particularly in the transverse direction, was significantly greater than that under the other two flood scenarios.
4.3 Erosion and deposition characteristics under effect of jet
The erosion and deposition patterns were contrasted in the ZOFE and ZOEF of the jet before and after flooding (Figures 9, 10, Table 2). Overall, the erosion zone was concentrated in the deep channel within the outlet and the front of the ZOFE, and the erosion distance of the west channel is much larger than the east channel. Sediment began to accumulate at the end of the ZOFE and ultimately formed a semi-circular deposition body in the ZOEF. The sediment deposition area toward the east was greater than that toward the southwest, and the deposition center was located at both ends of the east and west channels. The spatial patterns of erosion and deposition in the ME remained unchanged as flood intensity increased, whereas their magnitude and range were enhanced significantly.
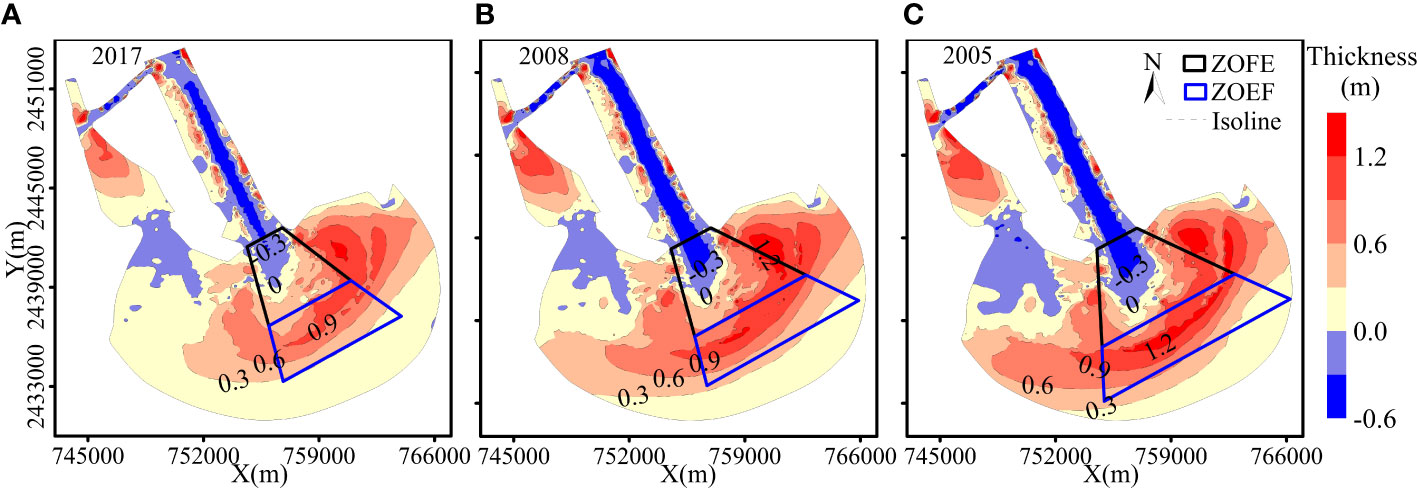
Figure 9 Erosion and deposition during the flood in 2017 (A), 2008 (B) and 2005 (C).
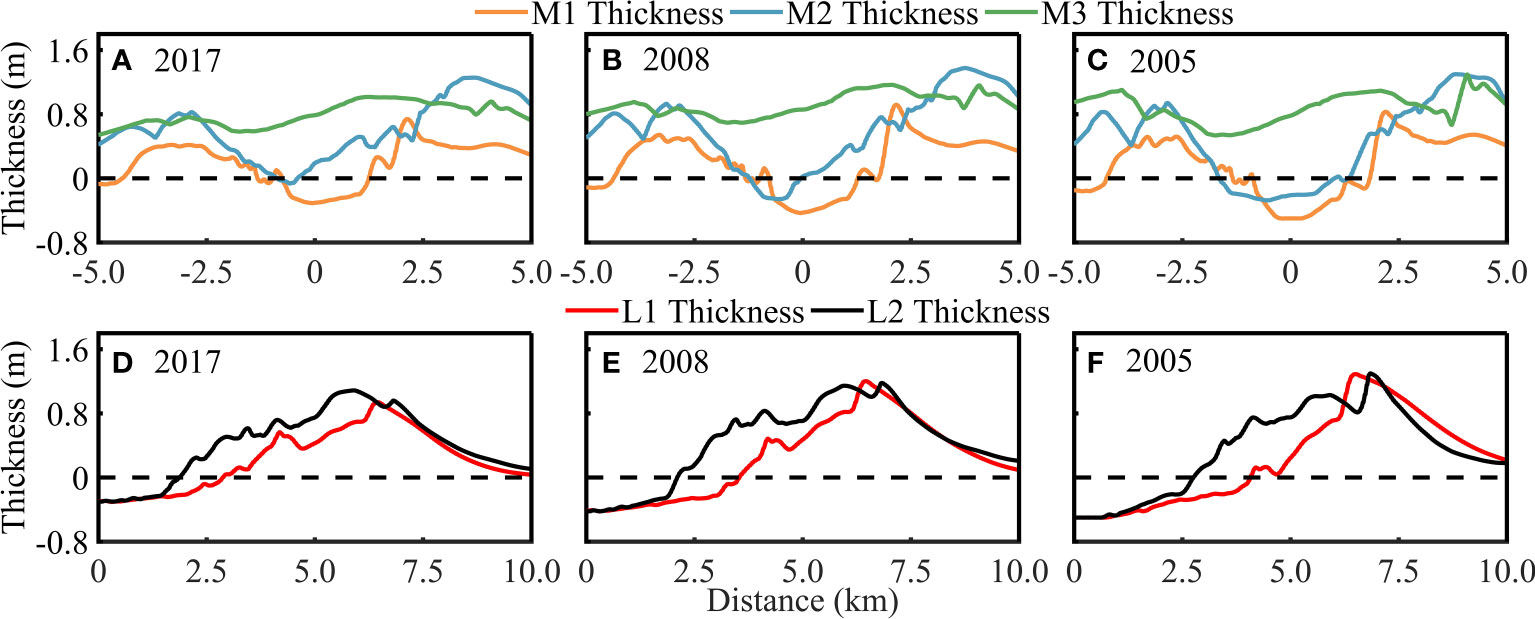
Figure 10 Thickness of erosion and deposition in the transverse sections during the 3 flood scenarios (A–C). Thickness of erosion and deposition in the longitudinal Sections during the 3 flood scenarios (D–F).
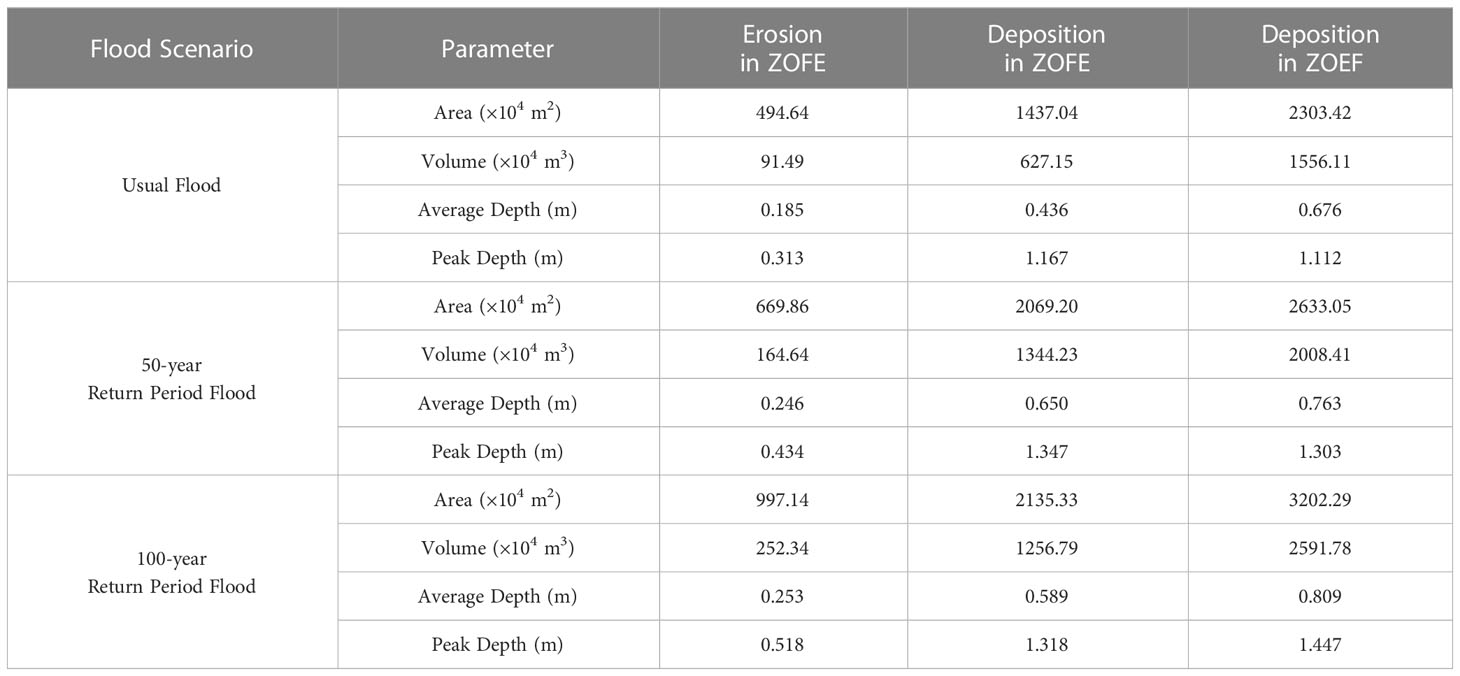
Table 2 Statistics of erosion and deposition.
The upstream ZOFE was dominated by erosion, which increased at higher flood intensities. Under usual flood scenario, the average erosion depth was 0.185 m, with a maximum depth of 0.313 m and an extent beyond the outlet of 2.88 km. In the west channel, erosion terminated near the 0.40 m/s velocity isoline. During 50- and 100-year return period flood scenarios, the average erosion depth increased by 6.10 and 6.80 cm, respectively, and the maximum erosion depth increased by 12.10 and 20.50 cm, respectively. The erosion extent also increased by 0.67 and 1.19 km, respectively, with erosion in the west channel approaching the 0.50 and 0.60 m/s velocity isolines, respectively.
Sediment accumulated at the downstream end of the ZOFE and exhibited significant deposition in the ZOEF. The extension distance and magnitude of sediment deposition area increased with higher flood intensity. Compared to usual flood scenario, the sediment deposition area increased by 329.63 × 10⁴ and 898.87 × 10⁴ m2 under 50- and 100-year return period flood scenarios, and the sediment deposition volume increased by 1.29 and 1.67 times, respectively. The average sediment deposition depth increased by 8.70 and 13.30 cm, respectively, and the maximum sediment deposition depth increased by 19.10 and 33.50 cm, respectively. Sediment deposition rates increased at higher flood intensities, with sediment deposition rates at L1 being 0.147 and 0.268 m/km higher under the 50- and 100-year return period flood scenarios, respectively, than under the usual flood scenario.
5 Discussion
5.1 Influences of estuarine geomorphology and tides
The shape of the jet is largely regulated by estuarine geomorphology. As for the ME, two channels have been developed due to the existence of the mouth bar, thus the jet is divided into two wing-like shapes rather than the standard fan shape (Figure 5). Similarly, jet in the Apalachicola estuary is found to exhibit two wing-like shapes (Fagherazzi et al., 2015). Differences in the river discharge and bed friction between east and west channels, which caused by width, depth, bottom slope and incident angles, likely contribute to the configurational asymmetry of jet (Edmonds and Slingerland, 2007, Edmonds and Slingerland, 2008; Jiménez-Robles et al., 2016; Jiménez-Robles and Ortega-Sánchez, 2018). In ME, the west channel, which is the main channel, is larger in width, depth, and bottom slope, but a smaller incident angle of flow, relative to the east channel, and then more flood water is drained through the west channel causing the jet to be directed toward the west (Figure 5).
Tidal dynamics play a crucial role in altering the range of jet diffusion. During flood tide, the direction of tidal flow is opposite to that of jet propulsion, resulting in suppression of the longitudinal jet diffusion. Conversely, the alignment of ebb flow and jet propulsion promotes jet expansion. Leonardi et al. (2013) also found that the jet diffusion range could reach a maximum during ebb tide and a minimum during flood tide based on Delft3D simulation results. Furthermore, the west channel, as the main tidal channel, was more susceptible to tidal effects than the east channel, leading the jet to deviate eastward during flood tide and westward during ebb tide (Figure 5). The previous studies focused on the tidal effects in meso- or macro tidal estuaries (Gelfenbaum, 1983; Xie et al., 2017; Xie et al., 2022), the study herein reveals that tidal dynamics play a significant role in regulating jet range, even in a river-dominated estuary with weak tidal effects.
During flood season, the high sediment transport capacity carried by strong runoff plays a dominant role in estuarine morphology. Compared to strong runoff discharge, wave dynamics are relatively weak with little effect on sediment transport; thus, the impact of wave has not been considered yet. Together, the above factors cause a discrepancy between the jet structure in the ME and an idealized jet structure, which only considers the inertia effect. The transverse expansion of the idealized jet increases linearly with distance, with a fully turbulent jet exhibiting an expansion rate (ε) of 0.22 and forming an angle of 12°24′ between the centerline and jet boundary. The velocity variation follows a Gaussian distribution with a similarity integral (I) of 0.316 (Stolzenbach and Harleman, 1971). In the longitudinal direction, the centerline velocity gradually decreases with distance, as follows:
Where umax is the maximum centerline velocity, u0 is the outlet velocity, b0 is the outlet width, x is the distance from the chosen section to the outlet section.
The velocity change is proportional to outlet width and inversely proportional to expansion rate, similarity integral of transverse velocity change and distance (Wright and Coleman, 1974). The results revealed that the theoretical value of umax is 5-10 times larger than the simulated value, and the maximum deviation is 20 times.
5.2 Linkage between flood jets and estuarine sedimentary regime
The ZOFE of a flood jet is a crucial area for bed erosion and sediment supply. During the dry season, the flow direction is toward the land, with an inlet velocity of approximately 0.5 m/s and velocity within the estuary of > 0.2 m/s during the flood tide. During the ebb tide, the flow direction is toward the sea, with an outlet velocity of approximately 0.6 m/s and velocity within the estuary of approximately 0.5 m/s (Gong et al., 2014; Liu et al., 2021). Conversely, during a flood period, the jet flows toward the sea with an outlet velocity of > 0.5 m/s and velocity within the ZOFE of > 0.4 m/s during the flood tide. During the ebb tide, the outlet velocity increases to > 0.8 m/s and the velocity in the ZOFE increases to > 0.5 m/s (Figure 5). When the flow is stronger, the jet velocity is higher and the flow direction is always toward the sea, thereby facilitating sediment transported to the sea. The sediment-carrying capacity of the jet can be calculated as follows (Zhang, 1961):
where U is the flow velocity, g is the acceleration due to gravity, h is the water depth, is the sediment settling velocity, and k and m are obtained based on the SSC as follows (Zhou et al., 2022):
Where C is the SSC.
During the flood tide, the sediment-carrying capacity of the jet is much lower than the SSC, leading to sediment accumulation. However, during the ebb tide, particularly at the peak ebb, the sediment-carrying capacity of the jet is much higher than the SSC, thus allowing the transport of a substantial amount of sediment toward the sea. Nonetheless, the SSC remains relatively high, mainly due to intense scouring of the bed by the jet, which causes a large amount of bed sediment to be suspended (Figures 11, 12). These findings are consistent with a previous study, which suggested that floods enhance the scouring and transport of suspended sediment toward the sea in estuaries (Wang et al., 2022).
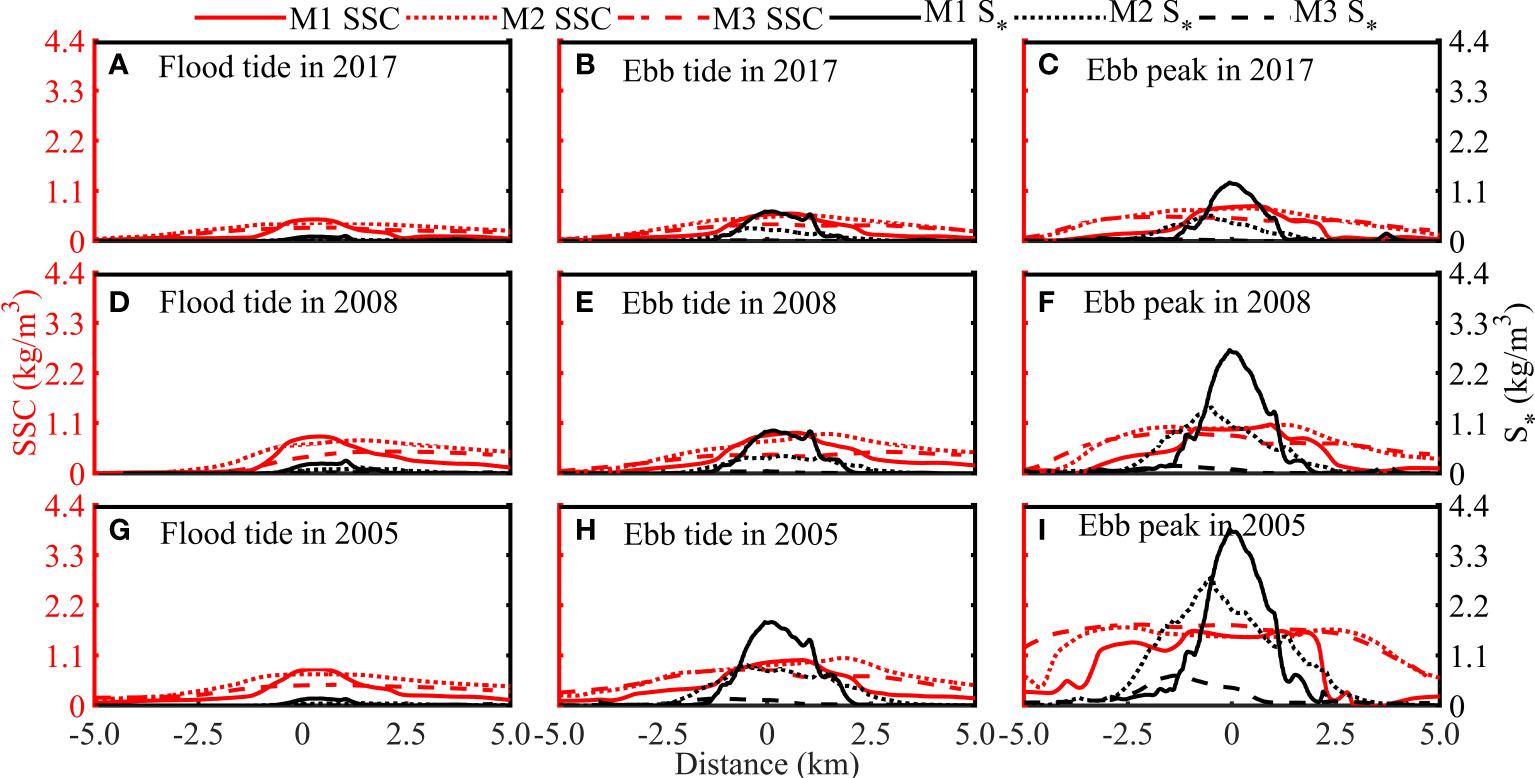
Figure 11 Variation of SSC and S* in the transverse sections during flood tide (A, D, G), during ebb tide, (B, E, H) and at peak ebb (C, F, I) during the 3 flood scenarios.
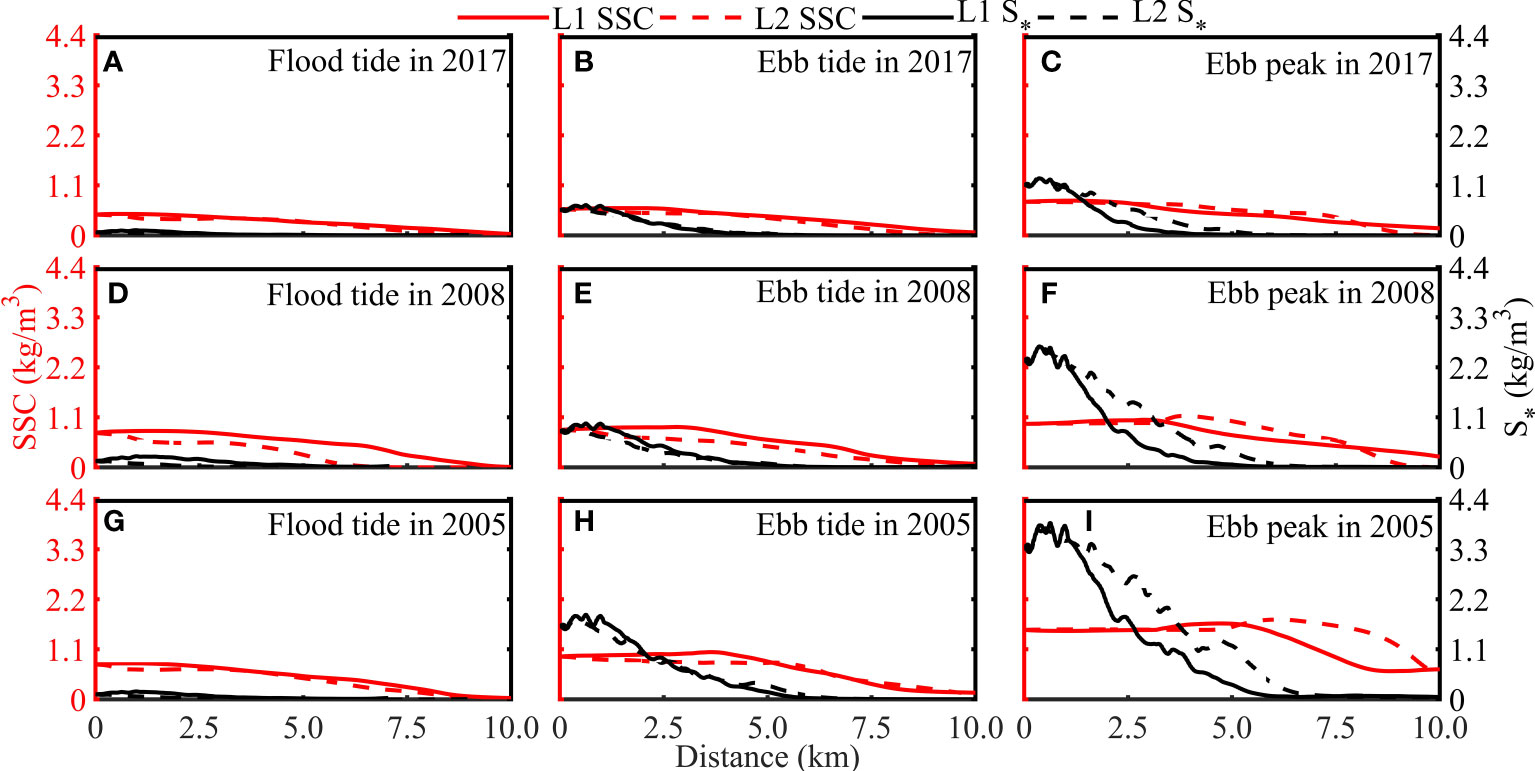
Figure 12 Variation of SSC and S* in the longitudinal sections during flood tide (A, D, G), during ebb tide, (B, E, H) and at peak ebb (C, F, I) during the 3 flood scenarios.
The ZOEF of a flood jet acts as an area of diffusion and deposition for sediment that is transported by floods and resuspended in the ZOEF. We found that the flow velocity decreased gradually to 0.3 m/s in the ZOEF, and this value was close to the ambient flow velocity. Even so, the SSC was significantly higher than the average SSC during the flood season (Figure 8). Simultaneously, the sediment-carrying capacity of the jet decreased rapidly, leading to a gradual decrease in the SSC. As a result, a limited amount of sediment was transported away by the jet, which led to significant deposition in the ZOEF and the formation of a long, semicircular deposition center. During floods, hydraulic energy in the estuary increases, resulting in strong scouring in the ZOFE and substantial sediment transport to the sea, in turn leading to rapid deposition in the ZOEF. This phenomenon is consistent with the findings of Wright and Coleman (1974) and Kitheka et al. (2005). Besides, the range of suspended sediment diffusion is larger than that of deposition. This is because sediment settling is a slow process when the sediment-carrying capacity is lower than a threshold.
Tidal currents could play a role in the suspended sediment dynamics outside the ZOEF, such as resulting in wider transverse than longitudinal sediment accumulation (Leonardi et al., 2013). Meanwhile, SSC and deposition on the east side were higher than those on the west side. The circular arc-shaped deposition center formed in the end of east channel, and a semicircular deposition center formed in the end of ZOEF. This phenomenon was caused by eastward deviation of the jet during the flood tide and westward deviation during the ebb tide; however, the lower flow velocity of the east channel during the flood tide limited sediment transport to the sea. Moreover, the larger angle between the east channel and outlet caused more sediment to settle in the east channel. Besides, tidal action intensified outside the jet, causing sediment to migrate toward to land. Because of the existence of Hezhou Channel in the west side of the ME, which led to stronger runoff, the sediment deposition in the west side of the ME is shallower than that in the east side of the ME.
Overall, the flood jet can induce a strong erosion in the ZOFE owing to the significantly intensified hydraulic energy and a dramatic deposition on the periphery beneficial from a plentiful sediment input from upstream (Kasvi et al., 2017; Choi et al., 2020). However, the estuary remains in a state of accumulation because floods carry a large amount of sediment from upstream areas (Figure 9).
5.3 Impact of flood intensity
Flood intensity is a major factor affecting the scale and internal characteristics of the jet, while its impact on jet structure and the morphology of sediment deposition is significant. Increasing flood intensity led to a significant increase in jet velocity and a marked expansion of its transverse range. However, the longitudinal diffusion distance showed little change, with only an increase in the ZOFE and a decrease in the ZOEF (Figure 5). At different flood intensities, the transverse flow velocity had a Gaussian distribution, whereas the jet developed predominantly on the east side during the flood tide, and on both the east and west sides during the ebb tide, and on the west side at the peak ebb. The longitudinal velocity showed an obvious linear decreasing trend. However, as flood intensity increased, the diffusion range of the ZOFE increased significantly in both transversely and longitudinally, whereas the ZOEF expanded transversely but decreased longitudinally. The average spreading rate of the jet increased accordingly. Therefore, flood intensity significantly altered the transverse diffusion range of the jet, but had little impact on the overall longitudinal diffusion range; instead, it mainly affected the distance between the boundary lines between the ZOFE and ZOEF and the outlet of the estuary.
Increasing flood intensity did not change the spatial patterns of erosion or deposition in the estuary; however, erosion occurred within the ZOFE of the jet and bed level became deeper and wider, and the location at which sediment began to settle was farther from the outlet. The deposition volume is similar within the ZOFE zone between different extreme flood scenarios, while was twice as much as that of the usual flood conditions. Not only the deposition thickness within the ZOEF of the jet increased significantly, but also the deposition amplitude increased. Increasing the flood intensity had little effect on the longitudinal deposition range within the ZOEF, but significantly increased the transverse deposition range.
5.4 Comparison with previous research
Due to the lack of bathymetric data before and after the flood in the ME, which caused the absence of validation of morphological changes, the simulation results were compared with those of previous studies. Li et al. (1993) and Jia et al. (2018) showed that during the flood season, the west channel of the ME experienced slight erosion, whereas the east channel was dominated by deposition. At the central mouth bar, erosion and deposition occurred simultaneously, with deposition dominating the crest and outer slope of the mouth bar, and erosion dominating its inner slope. Our results were generally consistent with these findings. We considered only large amounts of runoff and sediment transport during flooding, which caused greater erosion and deposition at the estuary.
Previous studies have indicated that floods, particularly extreme floods, can significantly affect estuarine geomorphology, resulting in substantial changes in erosion and deposition. Brocchini et al. (2017) compared erosion and deposition at the Misa River Estuary between the flood and dry seasons and found that deposition dominated the river channel during the dry season, while the estuary experienced slight erosion. However, during the flood season, the Misa River channel experienced slight erosion and the estuary experienced severe erosion, with a maximum depth of 1.5 m. A considerable amount of deposition occurred within the estuary, with a maximum thickness of 15 m. In the 0-20 m area of the Grand Rhône River Estuary, the average annual deposition during 1995-2003 was 0.47 × 10⁶ m3/year. However, during the 2003 flood, the amount of deposition in this area was 16.60 times the average annual deposition, reaching 7.8 × 10⁶ m3 (Maillet et al., 2006). He et al. (2020) found that the total amount of sediment entering the Lingding Channel was 4.65 × 10⁶ tons under usual flood and reached 16.65 × 10⁶ tons under extreme flood, leading to much greater sedimentation thickness in the river channel. Even in macro-tidal estuaries, floods can greatly affect estuarine geomorphology. As shown in the morphodynamic modeling by Xie et al. (2017), the Qiantang Estuary, China, suffers serious erosion induced by river flood events and then the riverbed gradually recovered in the following months due to sediment input by tides. This was further supported by field data (Xie et al., 2022). Based on these comparisons, the simulation results were considered to be acceptable.
6 Conclusions
Using the TELEMAC-MASCARET numerical model, the dynamics, suspended sediment distribution, and geomorphological changes at the ME were simulated under different flood scenarios, including usual, 50-year and 100-year return period floods, and studied the jet structure and sedimentation characteristics. The main conclusions are as follows.
As a flood flows out of the outlet, a jet structure forms, which diffuses in both the transverse and longitudinal directions. The flow velocity has a Gaussian distribution in the transverse direction and decreases linearly in the longitudinal direction. An increase in flood intensity significantly increases transverse diffusion, and the distance between the ZOFE-ZOEF boundary and outlet, but has little effect on the overall longitudinal diffusion distance.
In addition to flood intensity, the jet structure is also affected by the morphology and tidal effects, and exhibits obvious asymmetry. The west channel is the main channel for flow, having a larger width, depth, and bottom slope, and smaller incident angle, than the east channel. Thus, the west channel is restrained by tidal flow during the flood tide, which causes jet deflection to the east. During ebb tide, west channel flow is promoted, causing jet deflection to the west. Tides inhibit longitudinal diffusion and increase transverse diffusion.
Flood jet flows cause erosion near the outlet, leading to outward sediment transport and deposition outside the outlet. The ZOFE of the jet becomes the scouring center and sediment supply area, and the ZOEF of the jet acts as an area of diffusion and deposition in the estuary. The decline in sediment-carrying capacity of the jet reduces sediment transport. However, due to the lag in sediment settling, the range of sediment diffusion and deposition are larger than the range of the jet flow. Due to jet flow asymmetry and the effects of tides and geography, deposition is greater at the east side of the estuary than at the west side.
An increase in flood intensity does not alter the spatial patterns of erosion and deposition in the estuary. However, deeper scouring occurs in the ZOFE, and the magnitude of deposition in the ZOEF increases significantly, with a greater difference seen between usual and extreme flood scenarios. Flood intensity has a minor impact on the deposition range in the longitudinal direction but a significant impact in the transverse direction.
Data availability statement
The original contributions presented in the study are included in the article/Supplementary Material. Further inquiries can be directed to the corresponding authors.
Author contributions
JL: data and result analysis and manuscript draft preparation. LJ, WW and FL: project administration, funding support, conceptualization, supervision, and writing-review and editing. JL,YL and ZH: study conception, numerical simulation and methodology. All authors contributed to the article and approved the submitted version of the manuscript.
Funding
This study is funded by Guangdong Provincial Special key project of six Marine Industries in 2022 “Research on Three-dimensional Efficient Utilization of Marine Spatial Resources in Guangdong-Hong Kong-Macao Greater Bay Area” ([2022]49) and grants by the National Natural Science Foundation of China (Grant No. 42276173) and the Guangdong Basic and Applied Basic Research Foundation (No. 2023A1515030088).
Acknowledgments
Thanks to the Guangdong Provincial Department of Hydrology Bureau for providing relevant data of runoff and sediment in upstream boundary input. We thank the Editor and reviewers whose invaluable and constructive suggestions greatly improve the scientific quality of the original manuscript.
Conflict of interest
The authors declare that the research was conducted in the absence of any commercial or financial relationships that could be construed as a potential conflict of interest.
Publisher’s note
All claims expressed in this article are solely those of the authors and do not necessarily represent those of their affiliated organizations, or those of the publisher, the editors and the reviewers. Any product that may be evaluated in this article, or claim that may be made by its manufacturer, is not guaranteed or endorsed by the publisher.
Supplementary material
The Supplementary Material for this article can be found online at: https://www.frontiersin.org/articles/10.3389/fmars.2023.1186371/full#supplementary-material
References
Albertson M. L., Dai Y. B., Jensen R. A., Rouse H. (1950). Diffusion of submerged jets. Trans. Am. Soc. Civil Engineers 115 (1), 639–664. doi: 10.1061/TACEAT.0006302
Bates C. C. (1953). Rational theory of delta formation. Am. Assoc. Petroleum Geologists Bulls. 37 (9), 2119–2161. doi: 10.1306/5CEADD76-16BB-11D7-8645000102C1865D
Brocchini M., Calantoni J., Postacchini M., Sheremet A., Staples T., Smith J., et al. (2017). Comparison between the wintertime and summertime dynamics of the misa river estuary. Mar. Geol. 385, 27–40. doi: 10.1016/j.margeo.2016.12.005
Brondizio E. S., Foufoula-Georgiou E., Szabo S., Vogt N., Sebesvari Z., Renaud F. G. (2016). Catalyzing action towards the sustainability of deltas. Curr. Opin. Environ. Sustainability 19, 182–194. doi: 10.1016/j.cosust.2016.05.001
Chatanantavet P., Lamb M. P., Nittrouer J. A. (2012). Backwater controls of avulsion location on deltas. Geophys. Res. Lett. 39, L01402. doi: 10.1029/2011GL050197
Choi K., Kim D., Jo J. (2020). Morphodynamic evolution of the macrotidal sittaung river estuary, Myanmar: tidal versus seasonal controls. Mar. Geol. 430, 106367. doi: 10.1016/j.margeo.2020.106367
Cooper J. A. G. (1990). Ephemeral stream mouth bars at flood-breach river mouths: comparison with tidal deltas at barrier inlets. Mar. Geol. 96 (1), 57–70. doi: 10.1016/0025-3227(90)90021-B
Cooper J. A. G. (2002). The role of extreme floods in estuary-coastal behavior: contrasts between river- and tide-dominated microtidal estuaries. Sedimentary Geology. 150 (1-2), 123–137. doi: 10.1016/S0037-0738(01)00271-8
Edmonds D. A., Chadwick A. J., Lamb M. P., Lorenzo-Trueba J., Murray A. B., Nardin W., et al. (2021). Morphodynamic modeling of river-dominated deltas: a review and future perspectives. Earth Syst. Environ. Sci. doi: 10.1002/essoar.10507512.1
Edmonds D. A., Slingerland R. L. (2007). Mechanics of river mouth bar formation: implications for the morphodynamics of delta distributary networks. J. Geophys. Res. 112, F02034. doi: 10.1029/2006JF000574
Edmonds D. A., Slingerland R. L. (2008). Stability of delta distributary networks and their bifurcations. Water Resour. Res. 44, W0942. doi: 10.1029/2008WR006992
Fagherazzi S., Edmonds D. A., Nardin W., Leonardi N., Canestrelli A., Falcini F., et al. (2015). Dynamics of river mouth deposits. Rev. Geophys. 53, 642–672. doi: 10.1002/2014RG000451
Garel E., Sousa C., Ferreira ó., Morales J. A. (2014). Decadal morphological response of an ebb-tidal delta and down-drift beach to artificial breaching and inlet stabilization. Geomorphology 216, 13–25. doi: 10.1016/j.geomorph.2014.03.031
Garvine R. W. (1984). Radial spreading of buoyant, surface plumes in coastal waters. J. Geophysical Res. 89, 1989–1996. doi: 10.1029/JC089iC02p01989
Gelfenbaum G. (1983). Suspended-sediment response to semidiurnal and fortnightly tidal variations in a mesotidal estuary: Columbia river, U.S.A. Mar. Geology. 52 (1-2), 39–57. doi: 10.1016/0025-3227(83)90020-8
Gong W. P., Maa J. P. Y., Hong B., Shen J. (2014). Salt transport during a dry season in the modaomen estuary, pearl river delta, China. Ocean Coast. Manage. 100, 139–150. doi: 10.1016/j.ocecoaman.2014.03.024
Gong W. P., Shen J. (2011). The response of salt intrusion to changes in river discharge and tidal mixing during the dry season in the modaomen estuary, China. Continental Shelf Res. 31, 769–788. doi: 10.1016/j.csr.2011.01.011
Guan M. F., Wright N. G., Andrew Sleigh P. (2015). Multiple effects of sediment transport and geomorphic processes within flood events: modelling and understanding. Int. J. Sediment Res. 30, 371–381. doi: 10.1016/j.ijsrc.2014.12.001
Harris C. K., Traykovski P. A., Geyer W. R. (2005). Flood dispersal and deposition by near-bed gravitational sediment flows and oceanographic transport: a numerical modeling study of the eel river shelf, northern California. J. Geophysical Res. 110, C09025. doi: 10.1029/2004JC002727
He Z. X., Jia L. W., Jia Y. H., He J. W. (2020). Effects of flood events on sediment transport and deposition in the waterways of lingding bay, pearl river delta, China. Ocean Coast. Management. 185, 105062. doi: 10.1016/j.ocecoaman.2019.105062
He Z. X., Liang M. E., Jia L. W., Dong H. Y., Chen K. L., Liu J., et al. (2022). Long-term morphological modeling and implication for estuarine regulation of the modaomen estuary, pearl river delta, China. Appl. Ocean Res. 123, 103184. doi: 10.1016/j.apor.2022.103184
He Y., Ye R. H., Tang C. W., Yang L. Z. (2018). Relationship between the morphological evolution of the river mouth bar and fluvial input in the modaomen estuary. Environ. Earth Sci. 77, 668. doi: 10.1007/s12665-018-7856-x
Hervouet J. M. (2007). Hydrodynamics of free surface flows: modelling with the finite element method (Hoboken: Wiley Press), 360.
Hoitink A. J. F., Jay D. A. (2016). Tidal river dynamics: implications for deltas. Rev. Geophys. 54 (1), 240–272. doi: 10.1002/2015RG000507
Horner-Devine A. R., Hetland R. D., MacDonald D. G. (2015). Mixing and transport in coastal river plumes. Annu. Rev. Fluid Mechanics. 47, 569–594. doi: 10.1146/annurev-fluid-010313-141408
Jia L. W., Lv X. Y., Cheng C., He Z. X. (2018). Study on the morphological evolution of the modaomen estuary in monthly scale. Haiyang Xuebao 40 (9), 65–77. doi: 10.3969/j.issn.0253-4193.2018.09.006
Jia L. W., Pan S. Q., Wu C. Y. (2013). Effects of the anthropogenic activities on the morphological evolution of the modaomen estuary, pearl river delta, China. China Ocean Eng. 27 (6), 795–808. doi: 10.1007/s13344-013-0065-1
Jiang C., Pan S., Chen S. (2017). Recent morphological changes of the yellow river (Huanghe) submerged delta: causes and environmental implications. Geomorphology 293, 93–107. doi: 10.1016/j.geomorph.2017.04.036
Jiménez-Robles A. M., Ortega-Sánchez M. (2018). Implications of river discharge angle and basin slope on mouth bar morphology and discharge dynamics of stable jets. J. Hydraulic Engineering. 144 (9), 1–9. doi: 10.1061/(ASCE)HY.1943-7900.0001506
Jiménez-Robles A. M., Ortega-Sánchez M., Losada M. (2016). Effects of basin bottom slope on jet hydrodynamics and river mouth bar formation. J. Geophysical Res. - Earth Surface. 121, 1110–1133. doi: 10.1002/2016JF003871
Kasvi E., Laamanen L., Lotsari E., Alho P. (2017). Flow patterns and morphological changes in a sandy meander bend during a flood-spatially and temporally intensive ADCP measurement approach. Water 9, 106. doi: 10.3390/w9020106
Kitheka J. U., Obiero M., Nthenge P. (2005). River discharge, sediment transport and exchange in the tana estuary, Kenya. Estuar. Coast. Shelf Sci. 63 (3), 455–468. doi: 10.1016/j.ecss.2004.11.011
Lamb M. P., Nittrouer J. A., Mohrig D., Shaw J. (2012). Backwater and river plume controls on scour upstream of river mouths: implications for fluvio-deltaic morphodynamics. J. Geophys. Res. 117, F01002. doi: 10.1029/2011JF002079
Leonardi N., Canestrelli A., Sun T., Fagherazzi S. (2013). Effect of tides on mouth bar morphology and hydrodynamics. J. Geophys. Res. Oceans. 118, 4169–4183. doi: 10.1002/jgrc.20302
Li C. C., Tian X. P., Luo X. L. (1993). “The formation of evolution of the sand bar in modaomen estuary and its administration,” in Conference proceedings of the seventh national symposium on coastal engineering (Part I) (Beijing: China Ocean Press), 172–181.
Liu C. J., Zhong Z. Y., Xiao Y. Q., Chen X. Q., Yu M. H. (2021). Impacts of human activities on hydrodynamic structures during the dry season in the modaomen estuary. J. Mar. Sci. Eng. 9 (12), 1327. doi: 10.3390/jmse9121327
Lu Y. J., Jia L. W., Mo S. P., Han L. X., Ji R. Y., Zuo L. Q. (2008). Changes of low water level in the channel network system of the pearl river delta (Beijing: China Water & Power Press), 24 p.
Maillet G. M., Vella C., Berné S., Friend P. L., Amos C. L., Fleury T. J., et al. (2006). Morphological changes and sedimentary processes induced by the December 2003 flood event at the present mouth of the grand rhône river (southern France). Mar. Geol. 234 (1-4), 159–177. doi: 10.1016/j.margeo.2006.09.025
Nienhuis J. H., Ashton A. D., Edmonds D. A., Hoitink A. J., Kettner A. J., Rowland J. C., et al. (2020). Global-scale human impact on delta morphology has led to net land area gain. Nature 577 (7791), 514–518. doi: 10.1038/s41586-019-1905-9
Ozsoy E., Unluata U. (1982). Ebb-tidal flow characteristics near inlets. Estuar. Coast. Shelf Sci. 14 (3), 251–263. doi: 10.1016/S0302-3524(82)80015-7
Ratliff K. M., Hutton E. H. W., Murray A. B. (2018). Exploring wave and sea-level rise effects on delta morphodynamics with a coupled river-ocean model. J. Geophys. Res.: Earth Surface. 123 (11), 2887–2900. doi: 10.1029/2018JF004757
Rickenmann D., Badoux A., Hunzinger L. (2016). Significance of sediment transport processes during piedmont floods: the 2005 flood events in Switzerland. Earth Surf. Process. Landforms. 41 (2), 224–230. doi: 10.1002/esp.3835
Rijnsburger S., Flores R. P., Pietrzak J. D., Horner-Devine A. R., Souza A. J., Zijl F. (2021). The evolution of plume fronts in the Rhine region of freshwater influence. J. Geophysical Research: Oceans. 126, e2019JC015927. doi: 10.1029/2019JC015927
Stolzenbach K. D., Harleman D. R. F. (1971). An analytical and experimental investigation of surface discharges of heated water. Massachusetts Inst. Technology Ralph M. Parsons Lab. Water Resour. Hydrodynamics Dept. Civil Eng. Rept 135, 212.
Tilmes S., Brandt J., Flatøy F., Bergström R., Flemming J., Langner J., et al. (2002). Comparison of five eulerian air pollution forecasting systems for the summer of 1999 using the German ozone monitoring data. J. Atmos. Chem. 42, 91–121. doi: 10.1023/A:1015753302760
Unverricht D., Szczuciński W., Stattegger L., Jagodziński R., Le X. T., Kwong L. L. W. (2013). Modern sedimentation and morphology of the subaqueous Mekong delta, southern Vietnam. Glob. Planet. Change 110, 223–235. doi: 10.1016/j.gloplacha.2012.12.009
van Reeuwijk M. (2016). Turbulent transport and entertainment in jets and plumes: a DNS study. Phys. Rev. Fluids. 1, 074301. doi: 10.1061/JYCEAJ.0003740
Wang J., Dai Z. J., Fagherazzi S., Zhang X. H., Liu X. Q. (2022). Hydro-morphodynamics triggered by extreme riverine floods in a mega fluvial-tidal delta. Sci. Total Environment. 809, 152076. doi: 10.1016/j.scitotenv.2021.152076
Wright L. D., Coleman J. M. (1974). Mississippi River mouth processes: effluent dynamics and morphologic development. J. Geol. 82, 751–778. doi: 10.1086/628028
Wu C. Y., Bao Y., Ren J., Lei Y. P., Shi H. Y., He Z. G. (2006). Anumerical simulation and mophodynamic analysis on the evolution of the zhujiang river delta in China: 6000-2500a BP. Acta Oceanol. Sin. 28 (4), 64–80.
Xie D. F., Gao S., Wang Z. B., Pan C., Wu X., Wang Q. (2017). Morphodynamic modeling of a large inside sand bar and its dextral morphology in a convergent estuary: qiantang estuary, China. J. Geophysical Research: Earth Surface 122 (8), 1553–1572. doi: 10.1002/2017JF004293
Xie D. F., Wang Z. B., Huang J., Zeng J. (2022). River, tide and morphology interaction in a macro-tidal estuary with active morphological evolutions. Catena 212 (8), 106131. doi: 10.1016/j.catena.2022.106131
Yang L. Z., Liu F., Gong W. P., Cai H. Y., Yu F. H., Pan H. Z. (2019). Morphological response of lingding bay in the pearl river estuary to human intervention in recent decades. Ocean Coast. Manage. 176, 1–10. doi: 10.1016/j.ocecoaman.2019.04.011
Keywords: river-dominated estuary, flood, jet flow, sediment transport, sedimentary regime
Citation: Liu J, Lin Y, He Z, Liu F, Jia L and Wei W (2023) Flood-driven jet flow and sedimentary regime in a river-dominated estuary. Front. Mar. Sci. 10:1186371. doi: 10.3389/fmars.2023.1186371
Received: 14 March 2023; Accepted: 05 June 2023;
Published: 19 June 2023.
Edited by:
Yang Yang, Nanjing Normal University, ChinaReviewed by:
Miguel Ortega-Sánchez, University of Granada, SpainDongfeng Xie, Zhejiang Institute of Hydraulics & Estuary, China
Zhiyuan Wu, Changsha University of Science and Technology, China
Copyright © 2023 Liu, Lin, He, Liu, Jia and Wei. This is an open-access article distributed under the terms of the Creative Commons Attribution License (CC BY). The use, distribution or reproduction in other forums is permitted, provided the original author(s) and the copyright owner(s) are credited and that the original publication in this journal is cited, in accordance with accepted academic practice. No use, distribution or reproduction is permitted which does not comply with these terms.
*Correspondence: Liangwen Jia, jialwen@126.com; Wen Wei, weiw95@mail.sysu.edu.cn