
Cashew Gum (Anacardium occidentale) as a Potential Source for the Production of Tocopherol-Loaded Nanoparticles: Formulation, Release Profile and Cytotoxicity

 ,
,  , , ,
, , , 

Abstract
:1. Introduction
2. Materials and Methods
2.1. Materials
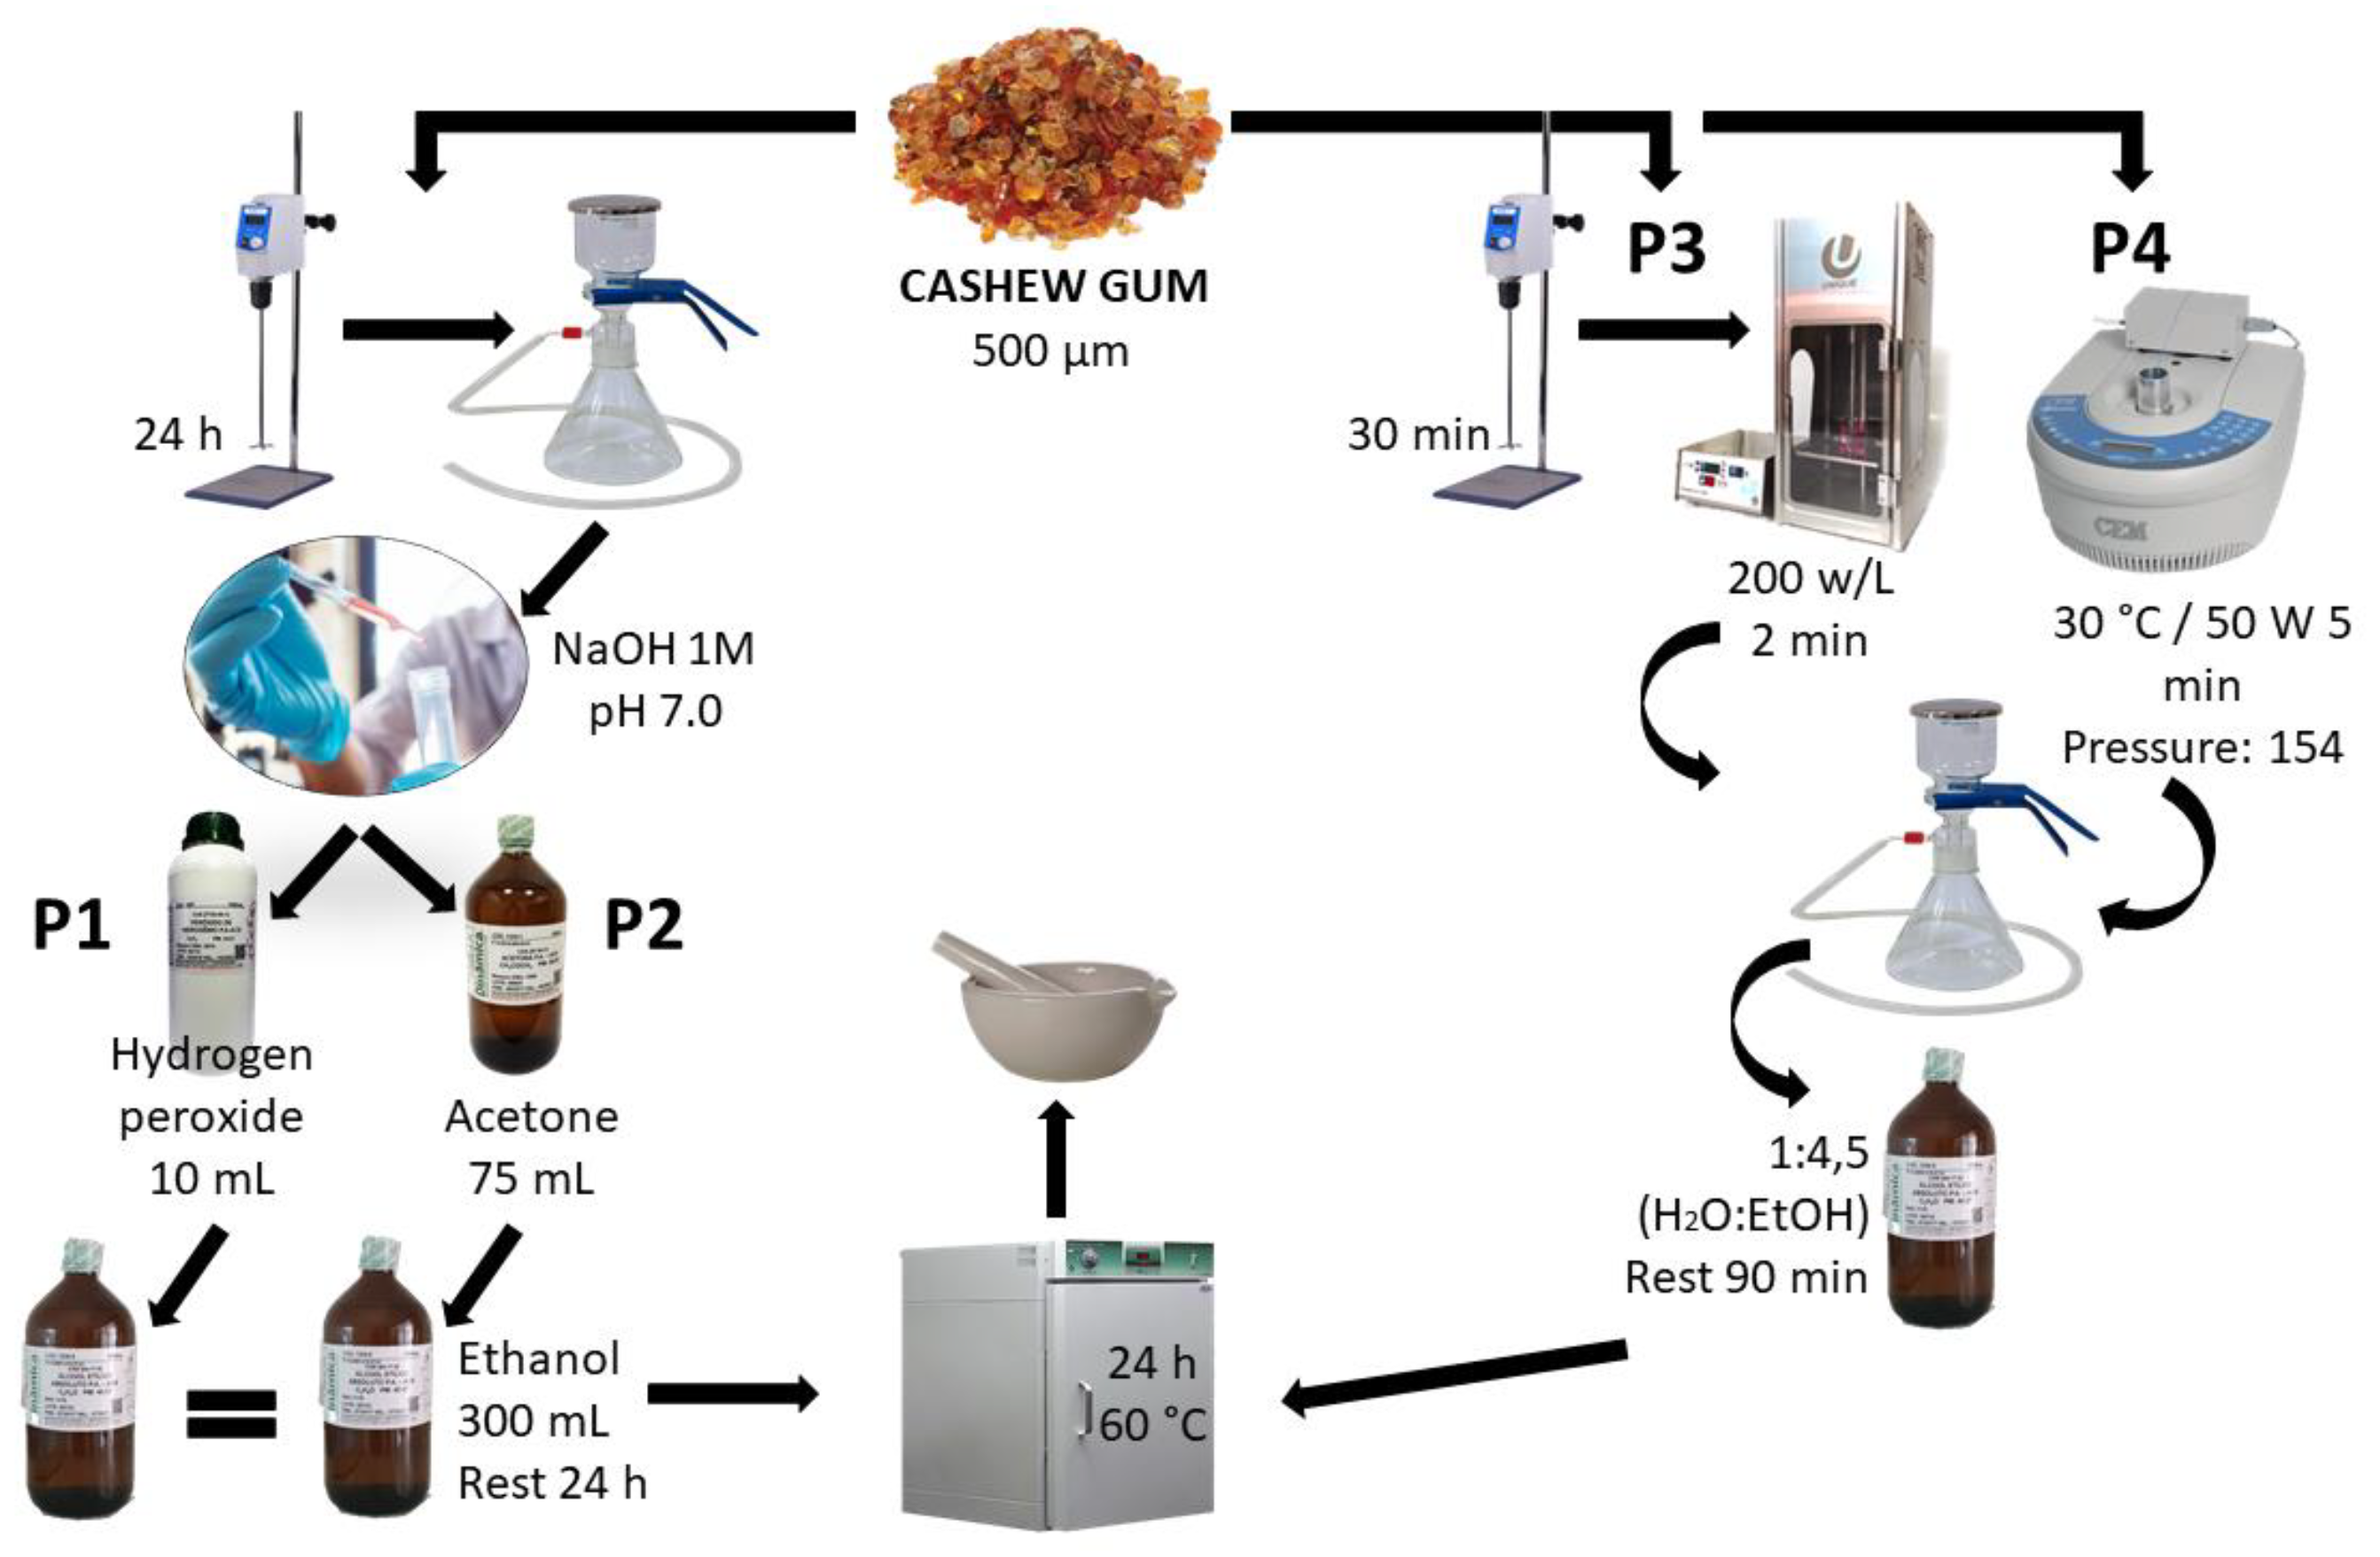
2.2. Cashew Gum Purification
2.3. Determination of the Production Yield
2.4. Production of Cashew Gum Particles
2.5. Determination of Total Ash and Moisture Content
2.6. Thermal Analysis
2.7. Physicochemical Analysis
2.8. Dynamic Light Scattering
2.9. Encapsulation Efficiency (EE) and Loading Capacity (LC)
2.10. Morphological Analysis
2.11. In Vitro Release Study
2.12. Cell Viability
2.13. Statistic
3. Results and Discussion
4. Conclusions
Author Contributions
Funding
Institutional Review Board Statement
Informed Consent Statement
Data Availability Statement
Conflicts of Interest
References
- Silva, R.A.O.; Marques, L.G.A.; de Freitas, R.M.; dos Santos, M.d.S.F.; avalcanti da Silva Filho, E.; do Ó Pessoa, C.; Santos, M.R.d.M.C. Prospecção tecnológica: Aplicação da goma do cajueiro (Anacardium occidentale) em nanotecnologia. Rev. Geintec-Gest. Inov. E Tecnol. 2013, 3, 55–69. [Google Scholar] [CrossRef] [Green Version]
- Ribeiro, A.J.; de Souza, F.R.L.; Bezerra, J.M.; Oliveira, C.; Nadvorny, D.; Monica, F.; Nunes, L.C.; Silva-Filho, E.C.; Veiga, F.; Sobrinho, J.L.S. Gums’ based delivery systems: Review on cashew gum and its derivatives. Carbohydr. Polym. 2016, 147, 188–200. [Google Scholar] [CrossRef]
- Anderson, D.M.; Bell, P.C.; Millar, J.R. Composition of gum exudates from Anacardium occidentale. Phytochemistry 1974, 13, 2189–2193. [Google Scholar] [CrossRef]
- Kamminga, T.; Slagman, S.J.; Martins Dos Santos, V.A.P.; Bijlsma, J.J.E.; Schaap, P.J. Risk-Based Bioengineering Strategies for Reliable Bacterial Vaccine Production. Trends Biotechnol. 2019, 37, 805–816. [Google Scholar] [CrossRef] [Green Version]
- Bezerra, J.M.; Oliveira, A.C.; Silva-Filho, E.C.; Severino, P.; Souto, S.B.; Souto, E.B.; Soares, M.F.L.R.; Soares-Sobrinho, J.L. The Potential Role of Polyelectrolyte Complex Nanoparticles Based on Cashew Gum, Tripolyphosphate and Chitosan for the Loading of Insulin. Diabetology 2021, 2, 107–116. [Google Scholar] [CrossRef]
- Loureiro, K.C.; Lima-Verde, I.B.; Johannisson, A.; Ntallaris, T.; Jager, A.; Štěpánek, P.; da Costa Mendonça, M.; Severino, P.; Morrell, J.M. Effects of cashew gum and nanoparticles on cooled stallion semen. Acta Vet. Scand. 2020, 62, 31. [Google Scholar] [CrossRef]
- Dias, S.F.L.; Nogueira, S.S.; de França Dourado, F.; Guimarães, M.A.; de Oliveira Pitombeira, N.A.; Gobbo, G.G.; Primo, F.L.; de Paula, R.C.M.; Feitosa, J.P.A.; Tedesco, A.C. Acetylated cashew gum-based nanoparticles for transdermal delivery of diclofenac diethyl amine. Carbohydr. Polym. 2016, 143, 254–261. [Google Scholar] [CrossRef]
- do Amaral Rodrigues, J.; de Araújo, A.R.; Pitombeira, N.A.; Plácido, A.; de Almeida, M.P.; Veras, L.M.C.; Delerue-Matos, C.; Lima, F.C.D.A.; Neto, A.B.; de Paula, R.C.M. Acetylated cashew gum-based nanoparticles for the incorporation of alkaloid epiisopiloturine. Int. J. Biol. Macromol. 2019, 128, 965–972. [Google Scholar] [CrossRef] [PubMed]
- Pitombeira, N.A.; Neto, J.G.V.; Silva, D.A.; Feitosa, J.P.; Paula, H.C.; de Paula, R.C. Self-assembled nanoparticles of acetylated cashew gum: Characterization and evaluation as potential drug carrier. Carbohydr. Polym. 2015, 117, 610–615. [Google Scholar] [CrossRef] [PubMed]
- Abreu, C.M.; Paula, H.C.; Seabra, V.; Feitosa, J.P.; Sarmento, B.; de Paula, R.C. Synthesis and characterization of non-toxic and thermo-sensitive poly (N-isopropylacrylamide)-grafted cashew gum nanoparticles as a potential epirubicin delivery matrix. Carbohydr. Polym. 2016, 154, 77–85. [Google Scholar] [CrossRef] [PubMed]
- Lima, M.R.; Paula, H.C.; Abreu, F.O.; da Silva, R.B.; Sombra, F.M.; de Paula, R.C. Hydrophobization of cashew gum by acetylation mechanism and amphotericin B encapsulation. Int. J. Biol. Macromol. 2018, 108, 523–530. [Google Scholar] [CrossRef] [PubMed]
- Cardial, M.R.L.; Paula, H.C.; da Silva, R.B.C.; da Silva Barros, J.F.; Richter, A.R.; Sombra, F.M.; de Paula, R.C. Pickering emulsions stabilized with cashew gum nanoparticles as indomethacin carrier. Int. J. Biol. Macromol. 2019, 132, 534–540. [Google Scholar] [CrossRef] [PubMed]
- Paula, H.C.; Sombra, F.M.; de Freitas Cavalcante, R.; Abreu, F.O.; de Paula, R.C. Preparation and characterization of chitosan/cashew gum beads loaded with Lippia sidoides essential oil. Mater. Sci. Eng.: C 2011, 31, 173–178. [Google Scholar] [CrossRef]
- Abreu, F.O.; Oliveira, E.F.; Paula, H.C.; de Paula, R.C. Chitosan/cashew gum nanogels for essential oil encapsulation. Carbohydr. Polym. 2012, 89, 1277–1282. [Google Scholar] [CrossRef] [Green Version]
- de Oliveira, E.F.; Paula, H.C.; de Paula, R.C. Alginate/cashew gum nanoparticles for essential oil encapsulation. Colloids Surf. B Biointerfaces 2014, 113, 146–151. [Google Scholar] [CrossRef]
- de Barros Fernandes, R.V.; Botrel, D.A.; Silva, E.K.; Borges, S.V.; de Oliveira, C.R.; Yoshida, M.I.; de Andrade Feitosa, J.P.; de Paula, R.C.M. Cashew gum and inulin: New alternative for ginger essential oil microencapsulation. Carbohydr. Polym. 2016, 153, 133–142. [Google Scholar] [CrossRef]
- Botrel, D.A.; Borges, S.V.; de Barros Fernandes, R.V.; Antoniassi, R.; de Faria-Machado, A.F.; de Andrade Feitosa, J.P.; de Paula, R.C.M. Application of cashew tree gum on the production and stability of spray-dried fish oil. Food Chem. 2017, 221, 1522–1529. [Google Scholar] [CrossRef] [PubMed]
- de Oliveira, W.Q.; Wurlitzer, N.J.; de Oliveira Araújo, A.W.; Comunian, T.A.; Bastos, M.d.S.R.; de Oliveira, A.L.; Magalhães, H.C.R.; Ribeiro, H.L.; de Figueiredo, R.W.; de Sousa, P.H.M. Complex coacervates of cashew gum and gelatin as carriers of green coffee oil: The effect of microcapsule application on the rheological and sensorial quality of a fruit juice. Food Res. Int. 2020, 131, 109047. [Google Scholar] [CrossRef]
- Pezo, F.; Yeste, M.; Zambrano, F.; Uribe, P.; Risopatrón, J.; Sánchez, R. Antioxidants and their effect on the oxidative/nitrosative stress of frozen-thawed boar sperm. Cryobiology 2021, 98, 5–11. [Google Scholar] [CrossRef]
- Nogueira, B.; Sampaio, B.; Souza, M.; Costa e Silva, E.; Zuccari, C. Coenzyme Q10 and α-Tocopherol Prevent the Lipid Peroxidation of Cooled Equine Semen. Reprod. Domest. Anim. 2015, 50, 1003–1010. [Google Scholar] [CrossRef] [PubMed]
- Martins, J.T.; Cerqueira, M.A.; Vicente, A.A. Influence of α-tocopherol on physicochemical properties of chitosan-based films. Food Hydrocoll. 2012, 27, 220–227. [Google Scholar] [CrossRef] [Green Version]
- Rodrigues, J.F.; de Paula, C.R.M.; Costa, S.M.O. Métodos de isolamento de gomas naturais: Comparação através da goma do cajueiro (Anacardium occidentale L.). Polímeros Ciência E Tecnol. 1993, 3, 31–36. [Google Scholar]
- Fessi, H.; Puisieux, F.; Devissaguet, J.P.; Ammoury, N.; Benita, S. Nanocapsule formation by interfacial polymer deposition following solvent displacement. Int. J. Pharm. 1989, 55, R1–R4. [Google Scholar] [CrossRef]
- Hakeem, R.B.; Opoku-Ameyaw, K.; Ellis, W.O.; Oldham, J.; Amoah, F.; Oduro, I.; Gyedu-Akoto, E. Physico-chemical properties of cashew tree gum. Afr. J. Food Sci. 2008, 2, 60–64. [Google Scholar]
- de Oliveira, A.M.; Jäger, E.; Jäger, A.; Stepánek, P.; Giacomelli, F.C. Physicochemical aspects behind the size of biodegradable polymeric nanoparticles: A step forward. Colloids Surf. A Physicochem. Eng. Asp. 2013, 436, 1092–1102. [Google Scholar] [CrossRef]
- Pooja, D.; Panyaram, S.; Kulhari, H.; Rachamalla, S.S.; Sistla, R. Xanthan gum stabilized gold nanoparticles: Characterization, biocompatibility, stability and cytotoxicity. Carbohydr. Polym. 2014, 110, 1–9. [Google Scholar] [CrossRef]
- Somchue, W.; Sermsri, W.; Shiowatana, J.; Siripinyanond, A. Encapsulation of α-tocopherol in protein-based delivery particles. Food Res. Int. 2009, 42, 909–914. [Google Scholar] [CrossRef]
- Schlachet, I.; Trousil, J.; Rak, D.; Knudsen, K.D.; Pavlova, E.; Nyström, B.; Sosnik, A. Chitosan-graft-poly (methyl methacrylate) amphiphilic nanoparticles: Self-association and physicochemical characterization. Carbohydr. Polym. 2019, 212, 412–420. [Google Scholar] [CrossRef] [PubMed]
- Ye, F.; Astete, C.E.; Sabliov, C.M. Entrapment and delivery of α-tocopherol by a self-assembled, alginate-conjugated prodrug nanostructure. Food Hydrocoll. 2017, 72, 62–72. [Google Scholar] [CrossRef]
- Mosmann, T. Rapid colorimetric assay for cellular growth and survival: Application to proliferation and cytotoxicity assays. J. Immunol. Methods 1983, 65, 55–63. [Google Scholar] [CrossRef]
- Team, R. A Language and Environment for Statistical Computing [Internet]; R Foundation for Statistical Computing: Vienna, Austria, 2012. [Google Scholar]
- Rodrigues, R.; Grosso, C. Cashew gum microencapsulation protects the aroma of coffee extracts. J. Microencapsul. 2008, 25, 13–20. [Google Scholar] [CrossRef]
- Klein, J.M.; Silva de Lima, V.; Couto da Feira, J.M.; Nichele Brandalise, R.; de Camargo Forte, M.M. Chemical modification of cashew gum with acrylamide using an ultrasound-assisted method. J. Appl. Polym. Sci. 2016, 133, 43634. [Google Scholar] [CrossRef]
- Da Silveira Nogueira Lima, R.; Rabelo Lima, J.; Ribeiro de Salis, C.; de Azevedo Moreira, R. Cashew-tree (Anacardium occidentale L.) exudate gum: A novel bioligand tool. Biotechnol. Appl. Biochem. 2002, 35, 45–53. [Google Scholar] [CrossRef] [PubMed]
- Naka, T.; Martin, D.K.; Soumaila, D.; Simplice, G.T.; Patrice, K.L.; Abrogoua, N. Some physico-chemical properties of cashew gum from cashew exudates and its use as clarifying agent of juice from cashew apple. Agric. Biol. J. N. Am. 2016, 7, 107–115. [Google Scholar]
- Mahdavi, S.A.; Jafari, S.M.; Assadpoor, E.; Dehnad, D. Microencapsulation optimization of natural anthocyanins with maltodextrin, gum Arabic and gelatin. Int. J. Biol. Macromol. 2016, 85, 379–385. [Google Scholar] [CrossRef]
- Oliveira, M.; Furtado, R.; Bastos, M.; Leitão, R.; Benevides, S.; Muniz, C.; Cheng, H.; Biswas, A. Performance evaluation of cashew gum and gelatin blend for food packaging. Food Packag. Shelf Life 2018, 17, 57–64. [Google Scholar] [CrossRef]
- Silva, D.A.; Feitosa, J.P.; Maciel, J.S.; Paula, H.C.; de Paula, R.C. Characterization of crosslinked cashew gum derivatives. Carbohydr. Polym. 2006, 66, 16–26. [Google Scholar] [CrossRef]
- Vasconcelos Silva, E.L.; Oliveira, A.C.J.; Patriota, Y.B.G.; Ribeiro, A.J.; Veiga, F.; Hallwass, F.; Silva-Filho, E.C.; da Silva, D.A.; Soares, M.F.R.; Wanderley, A.G.; et al. Solvent-free synthesis of acetylated cashew gum for oral delivery system of insulin. Carbohydr. Polym. 2019, 207, 601–608. [Google Scholar] [CrossRef]
- Martínez Rivas, C.J.; Tarhini, M.; Badri, W.; Miladi, K.; Greige-Gerges, H.; Nazari, Q.A.; Galindo Rodríguez, S.A.; Román, R.; Fessi, H.; Elaissari, A. Nanoprecipitation process: From encapsulation to drug delivery. Int. J. Pharm. 2017, 532, 66–81. [Google Scholar] [CrossRef]
- Camli, S.T.; Buyukserin, F.; Balci, O.; Budak, G.G. Size controlled synthesis of sub-100 nm monodisperse poly(methylmethacrylate) nanoparticles using surfactant-free emulsion polymerization. J. Colloid Interface Sci. 2010, 344, 528–532. [Google Scholar] [CrossRef]
- Noronha, C.M.; Granada, A.F.; de Carvalho, S.M.; Lino, R.C.; de, O.B.; Maciel, M.V.; Barreto, P.L.M. Optimization of α-tocopherol loaded nanocapsules by the nanoprecipitation method. Ind. Crop. Prod. 2013, 50, 896–903. [Google Scholar] [CrossRef]
- Luo, Y.; Zhang, B.; Whent, M.; Yu, L.L.; Wang, Q. Preparation and characterization of zein/chitosan complex for encapsulation of α-tocopherol, and its in vitro controlled release study. Colloids Surf. B Biointerfaces 2011, 85, 145–152. [Google Scholar] [CrossRef] [PubMed]
- Basiri, L.; Rajabzadeh, G.; Bostan, A. α-Tocopherol-loaded niosome prepared by heating method and its release behavior. Food Chem. 2017, 221, 620–628. [Google Scholar] [CrossRef] [PubMed] [Green Version]
- Sin, L.T.; Bee, S.T.; Tee, T.T.; Kadhum, A.A.; Ma, C.; Rahmat, A.R.; Veerasamy, P. Characterization of α-tocopherol as interacting agent in polyvinyl alcohol-starch blends. Carbohydzr. Polym. 2013, 98, 1281–1287. [Google Scholar] [CrossRef]
- He, J.; Shi, H.; Huang, S.; Han, L.; Zhang, W.; Zhong, Q. Core-Shell Nanoencapsulation of α-Tocopherol by Blending Sodium Oleate and Rebaudioside A: Preparation, Characterization, and Antioxidant Activity. Molecules 2018, 23, 3183. [Google Scholar] [CrossRef] [Green Version]
- Hu, J.; Zhang, Y.; Xiao, Z.; Wang, X. Preparation and properties of cinnamon-thyme-ginger composite essential oil nanocapsules. Ind. Crop. Prod. 2018, 122, 85–92. [Google Scholar] [CrossRef]
- Ghayempour, S.; Montazer, M.; Mahmoudi Rad, M. Tragacanth gum as a natural polymeric wall for producing antimicrobial nanocapsules loaded with plant extract. Int. J. Biol. Macromol. 2015, 81, 514–520. [Google Scholar] [CrossRef]
- Korsmeyer, R.W.; Peppas, N.A. Effect of the morphology of hydrophilic polymeric matrices on the diffusion and release of water soluble drugs. J. Membr. Sci. 1981, 9, 211–227. [Google Scholar] [CrossRef]
- Hixson, A.W.; Crowell, J.H. Dependence of Reaction Velocity upon surface and Agitation. Ind. Eng. Chem. 1931, 23, 923–931. [Google Scholar] [CrossRef]
- Higuchi, T. Mechanism of sustained-action medication. Theoretical analysis of rate of release of solid drugs dispersed in solid matrices. J. Pharm. Sci. 1963, 52, 1145–1149. [Google Scholar] [CrossRef]
- Bravo, S.A.; Lamas, M.C.; Salamón, C.J. In-vitro studies of diclofenac sodium controlled-release from biopolymeric hydrophilic matrices. J. Pharm. Pharm. Sci. 2002, 5, 213–219. [Google Scholar]
- Peppas, N.A.; Sahlin, J.J. A simple equation for the description of solute release. III. Coupling of diffusion and relaxation. Int. J. Pharm. 1989, 57, 169–172. [Google Scholar] [CrossRef]
- Hao, J.; Fang, X.; Zhou, Y.; Wang, J.; Guo, F.; Li, F.; Peng, X. Development and optimization of solid lipid nanoparticle formulation for ophthalmic delivery of chloramphenicol using a Box-Behnken design. Int. J. Nanomed. 2011, 6, 683–692. [Google Scholar] [CrossRef] [Green Version]
- Lages, E.B.; Fernandes, R.S.; Silva, J.O.; de Souza, Â.M.; Cassali, G.D.; de Barros, A.L.B.; Miranda Ferreira, L.A. Co-delivery of doxorubicin, docosahexaenoic acid, and α-tocopherol succinate by nanostructured lipid carriers has a synergistic effect to enhance antitumor activity and reduce toxicity. Biomed. Pharm. 2020, 132, 110876. [Google Scholar] [CrossRef] [PubMed]


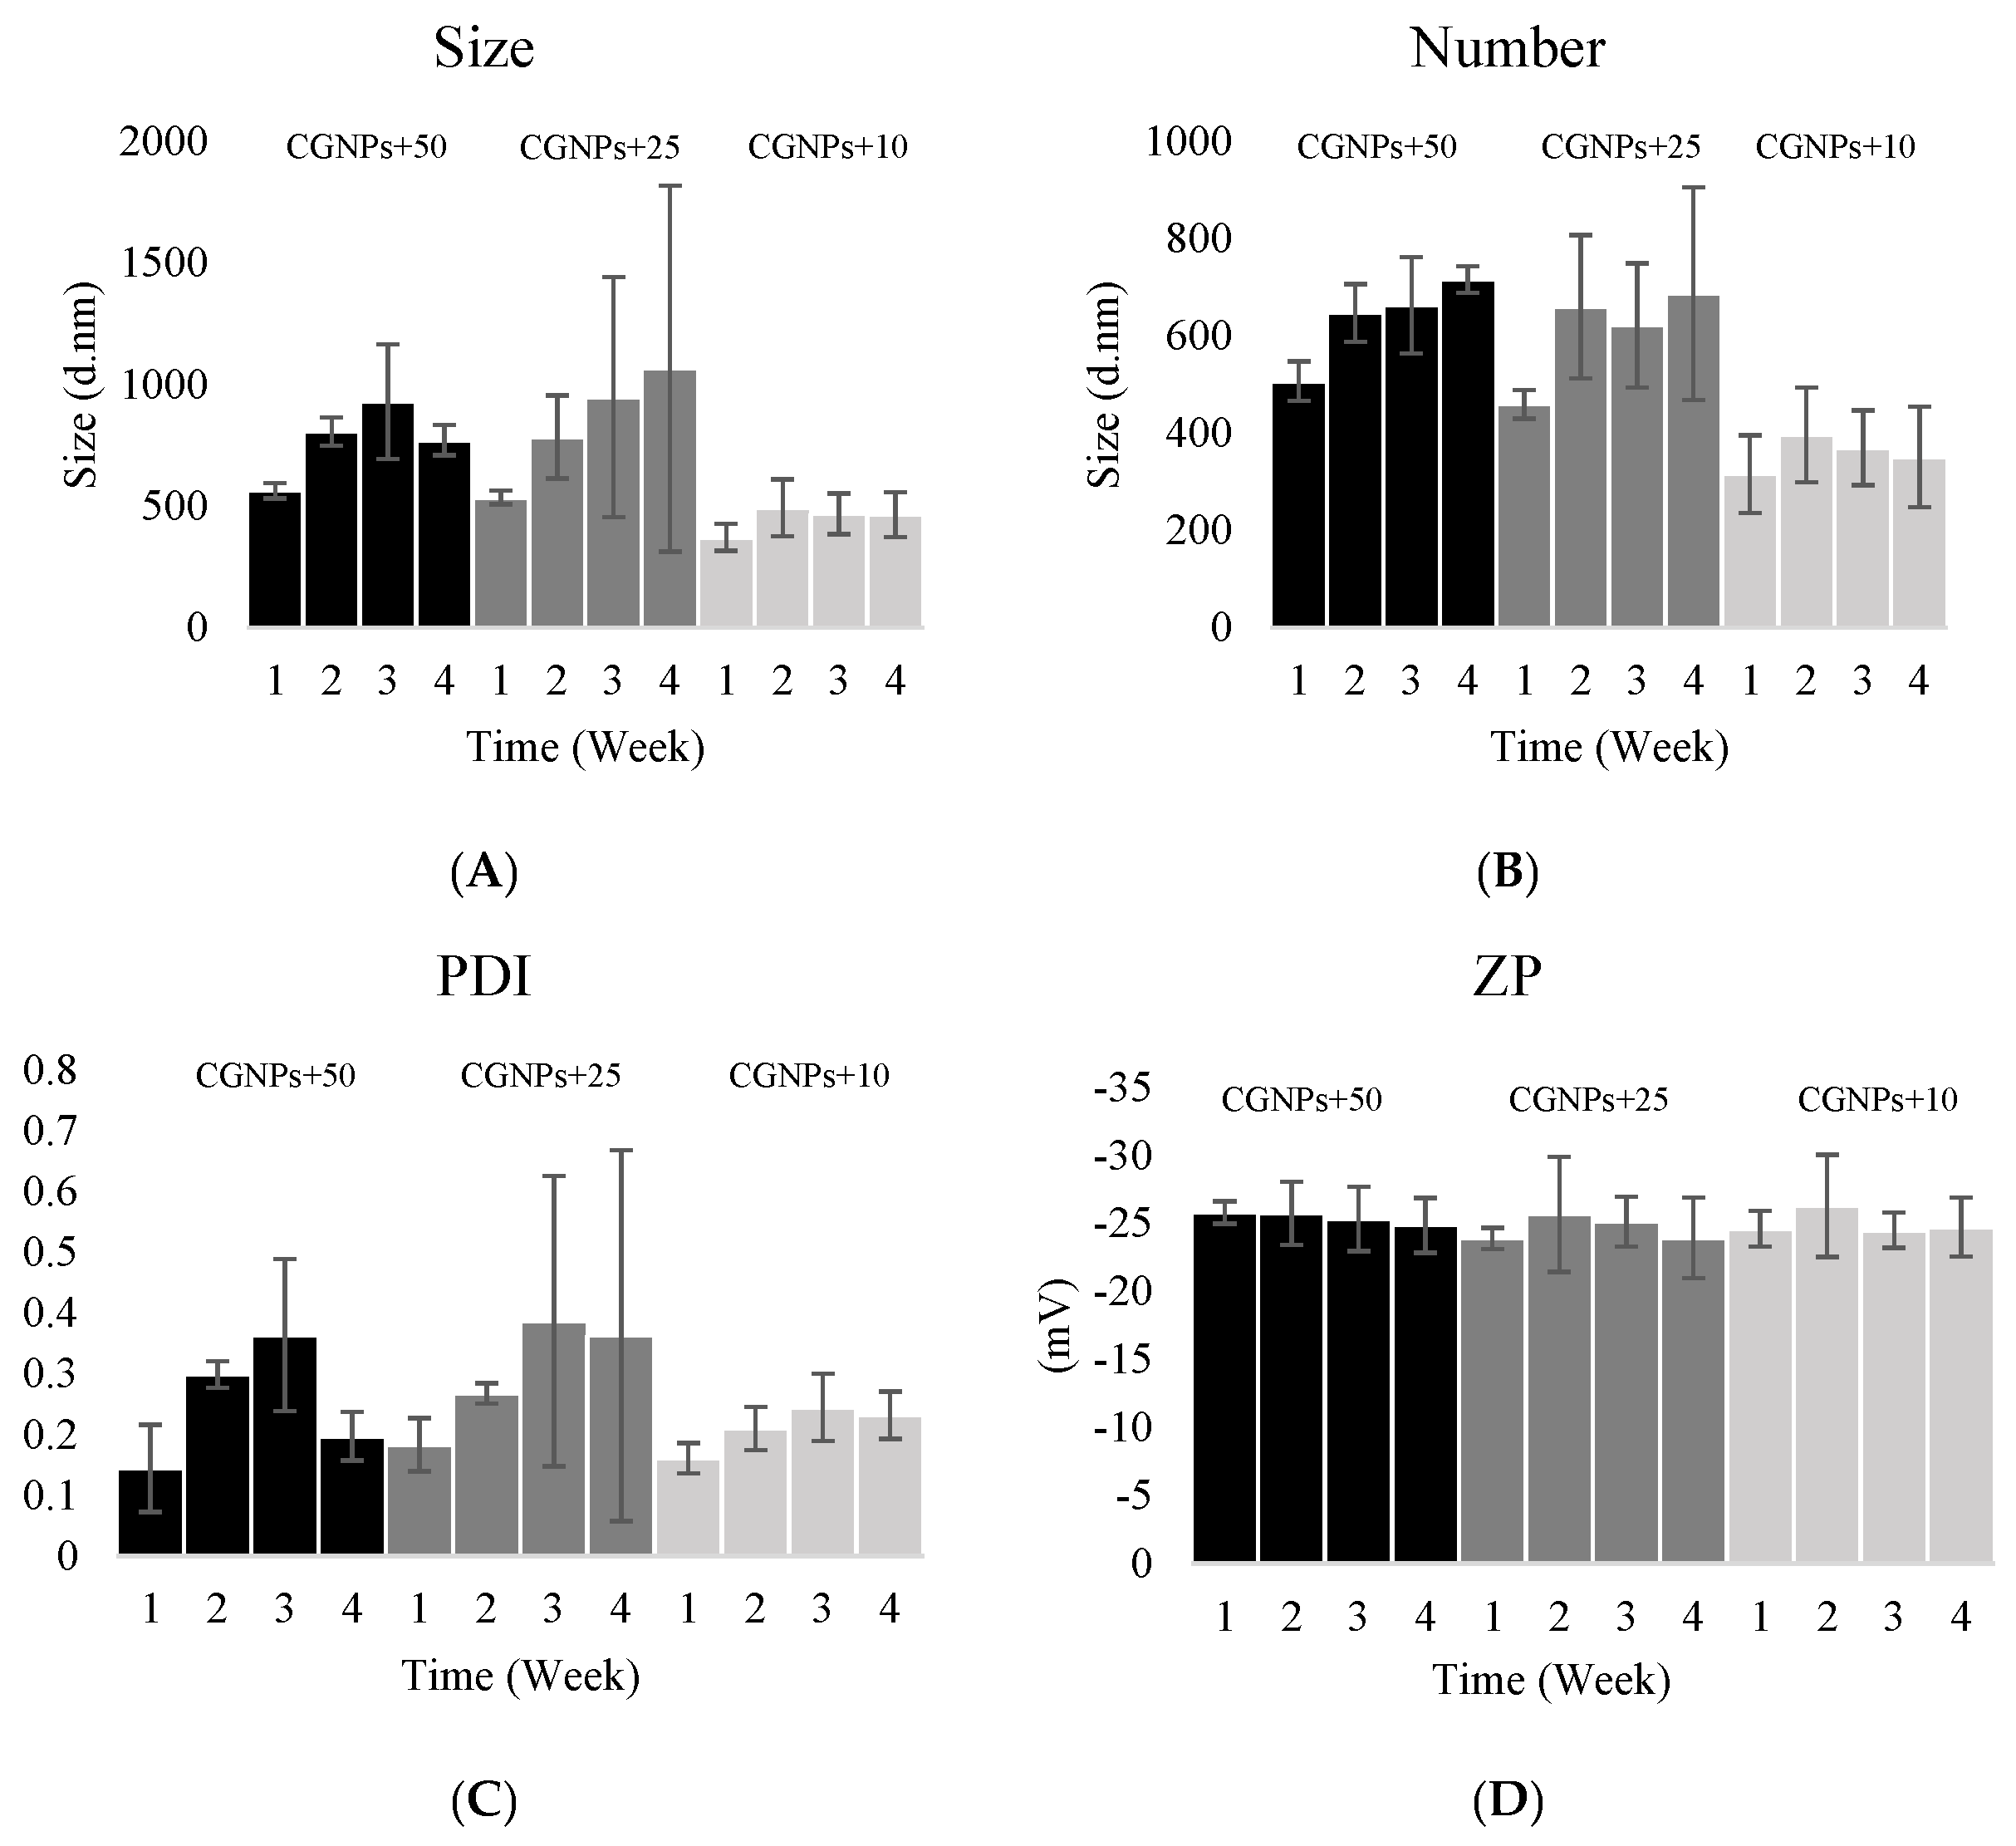
| Samples | Volume (d·nm) | Size (d·nm) | Number (d·nm) | PDI | ZP (mV) | E.E. (%) | L.C. (%) |
|---|---|---|---|---|---|---|---|
| CG | 7.0 ± 2.64 | - | - | - | −2.98 ± 0.91 | - | - |
| CGNPs+50 | 645.9 ± 69.7 | 562.96 ± 32.26 a | 506.73 ± 40.59 a | 0.14 ± 0.07 a | −25.8 ± 0.81 a | 99.93 ± 0.104 a | 32.92 ± 0.365 |
| CGNPs+25 | 624.4 ± 44.88 | 535.00 ± 28.12 a | 459.37 ± 29.37 a | 0.18 ± 0.04 a | −23.9 ± 0.78 a | 100.00 ± 0.742 a | 19.76 ± 0.080 |
| CGNPs+10 | 448.4 ± 39.19 | 370.97 ± 55.80 b | 315.70 ± 79.83 b | 0.16 ± 0.02 a | −24.6 ± 1.31 a | 100.00 ± 0.379 a | 8.91 ± 0.089 |
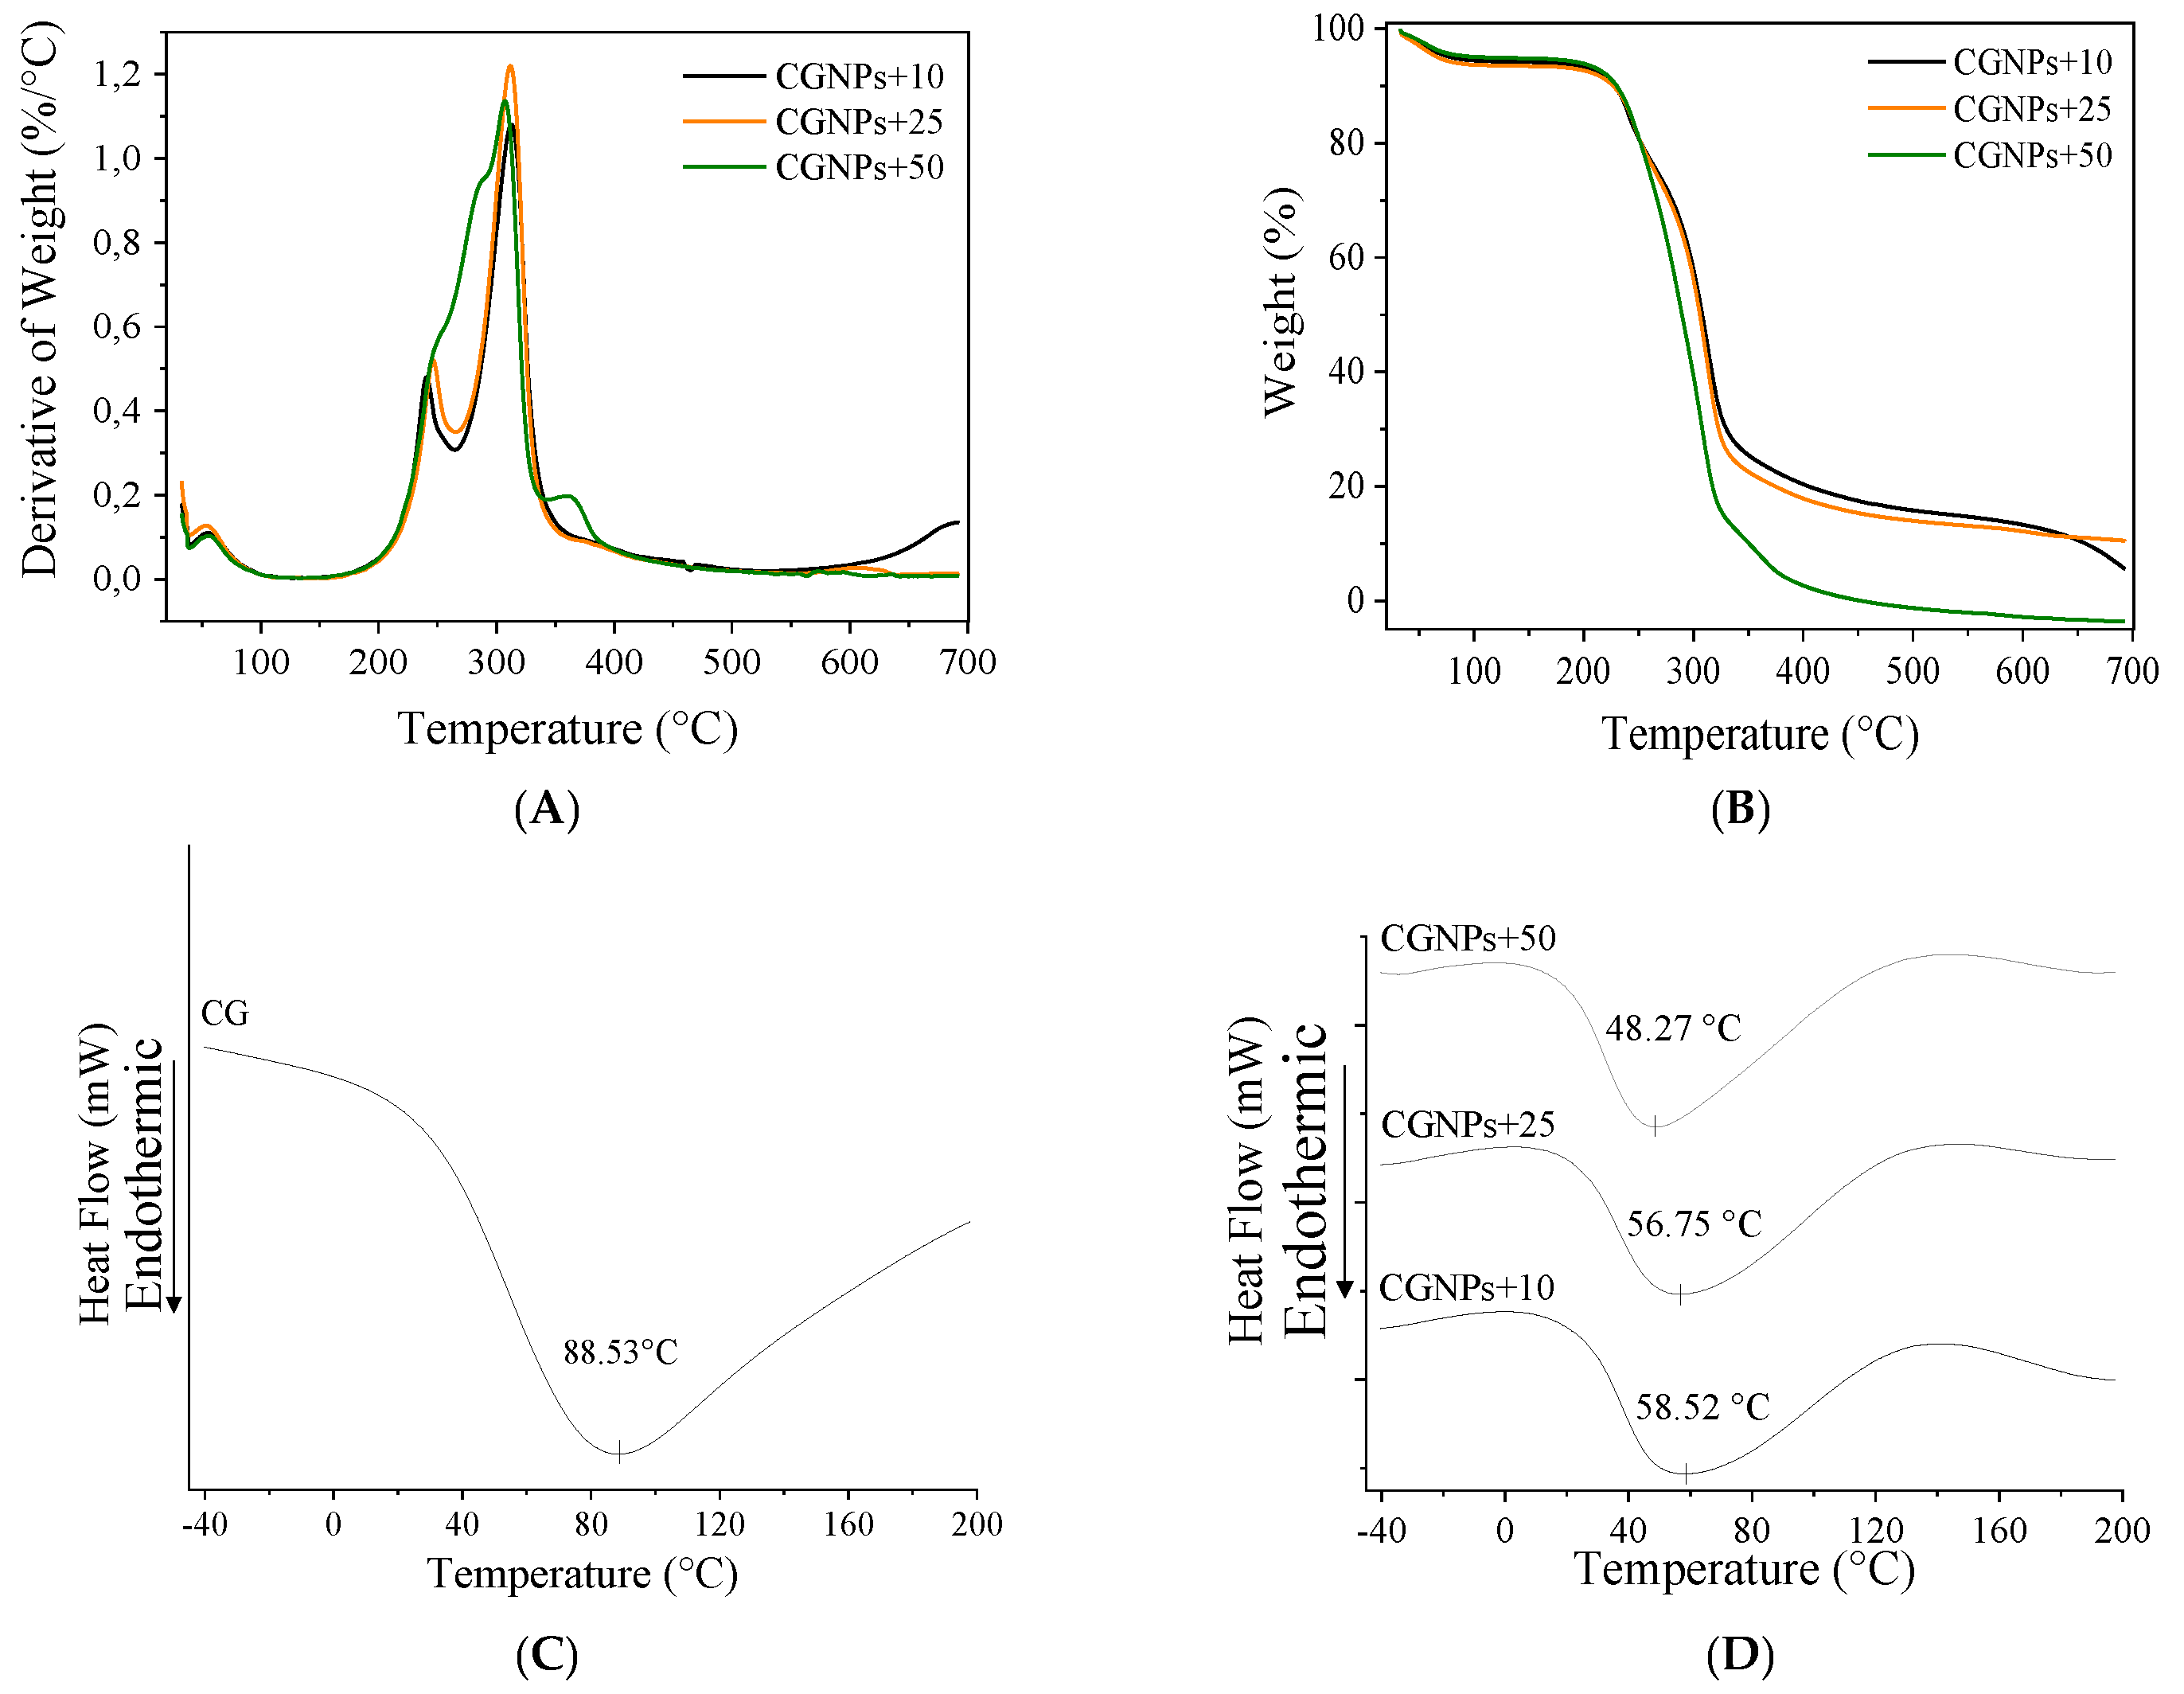
| Sample/Parameters | D0.1 | D1/2 | MRTD | The Residue (%) |
|---|---|---|---|---|
| CGNPs+10 | 272.23 | 312.44 | 330.82 | 12.47 |
| CGNPs+25 | 277.28 | 312.13 | 330.79 | 11.56 |
| CGNPs+50 | 265.29 | 308.23 | 327.87 | 0.0 |
| Mathematical Models | r Squared Value (r2) CGNPs+10 |
|---|---|
| Korsmeyer–Peppas | 1 |
| Hixon and Crowell | 0.999611 |
| Higuchi | 0.927562 |
| First Order | 0.999137 |
Publisher’s Note: MDPI stays neutral with regard to jurisdictional claims in published maps and institutional affiliations. |
© 2021 by the authors. Licensee MDPI, Basel, Switzerland. This article is an open access article distributed under the terms and conditions of the Creative Commons Attribution (CC BY) license (https://creativecommons.org/licenses/by/4.0/).
Share and Cite
Loureiro, K.C.; Jäger, A.; Pavlova, E.; Lima-Verde, I.B.; Štěpánek, P.; Sangenito, L.S.; Santos, A.L.S.; Chaud, M.V.; Barud, H.S.; Soares, M.F.L.R.; et al. Cashew Gum (Anacardium occidentale) as a Potential Source for the Production of Tocopherol-Loaded Nanoparticles: Formulation, Release Profile and Cytotoxicity. Appl. Sci. 2021, 11, 8467. https://doi.org/10.3390/app11188467
Loureiro KC, Jäger A, Pavlova E, Lima-Verde IB, Štěpánek P, Sangenito LS, Santos ALS, Chaud MV, Barud HS, Soares MFLR, et al. Cashew Gum (Anacardium occidentale) as a Potential Source for the Production of Tocopherol-Loaded Nanoparticles: Formulation, Release Profile and Cytotoxicity. Applied Sciences. 2021; 11(18):8467. https://doi.org/10.3390/app11188467
Chicago/Turabian StyleLoureiro, Kahynna C., Alessandro Jäger, Ewa Pavlova, Isabel B. Lima-Verde, Petr Štěpánek, Leandro S. Sangenito, André L. S. Santos, Marco V. Chaud, Hernane S. Barud, Mônica F. La R. Soares, and et al. 2021. "Cashew Gum (Anacardium occidentale) as a Potential Source for the Production of Tocopherol-Loaded Nanoparticles: Formulation, Release Profile and Cytotoxicity" Applied Sciences 11, no. 18: 8467. https://doi.org/10.3390/app11188467